**Date: **Sat, Jan 03, 2026 | 04:25 PM GMT
As 2026 kicks off, the broader cryptocurrency market is showing renewed stability. Ethereum (ETH) has reclaimed the $3,100 level, and momentum is gradually rotating into select altcoins — including World Liberty Financial (WLFI).
WLFI has jumped nearly 9% on the day, extending its weekly gains to around 16%, but the more important development is unfolding on the chart. On lower timeframes, price action is forming a well-defined bullish structure, suggesting that the token may be gearing up for a meaningful breakout if key levels are reclaimed.
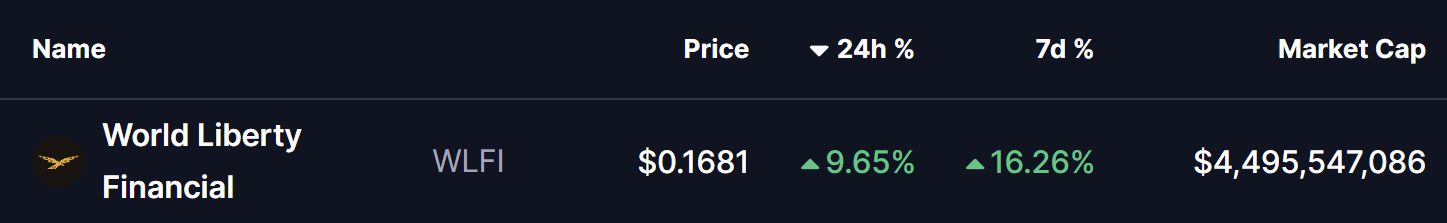
Source: Coinmarketcap
Ascending Triangle In Play
On the 4-hour chart, WLFI is forming a clear ascending triangle, characterized by a series of higher lows pushing steadily into a flat resistance zone. This pattern is widely viewed as a bullish continuation setup, especially when it develops during a prolonged consolidation phase accompanied by consistent dip-buying.
WLFI recently faced rejection near the $0.1741 resistance zone, which capped multiple upside attempts. That rejection pushed price back toward the rising support trendline, with buyers stepping in around the $0.1222 region. Importantly, each pullback has been shallower than the last, reinforcing the presence of strong underlying demand.
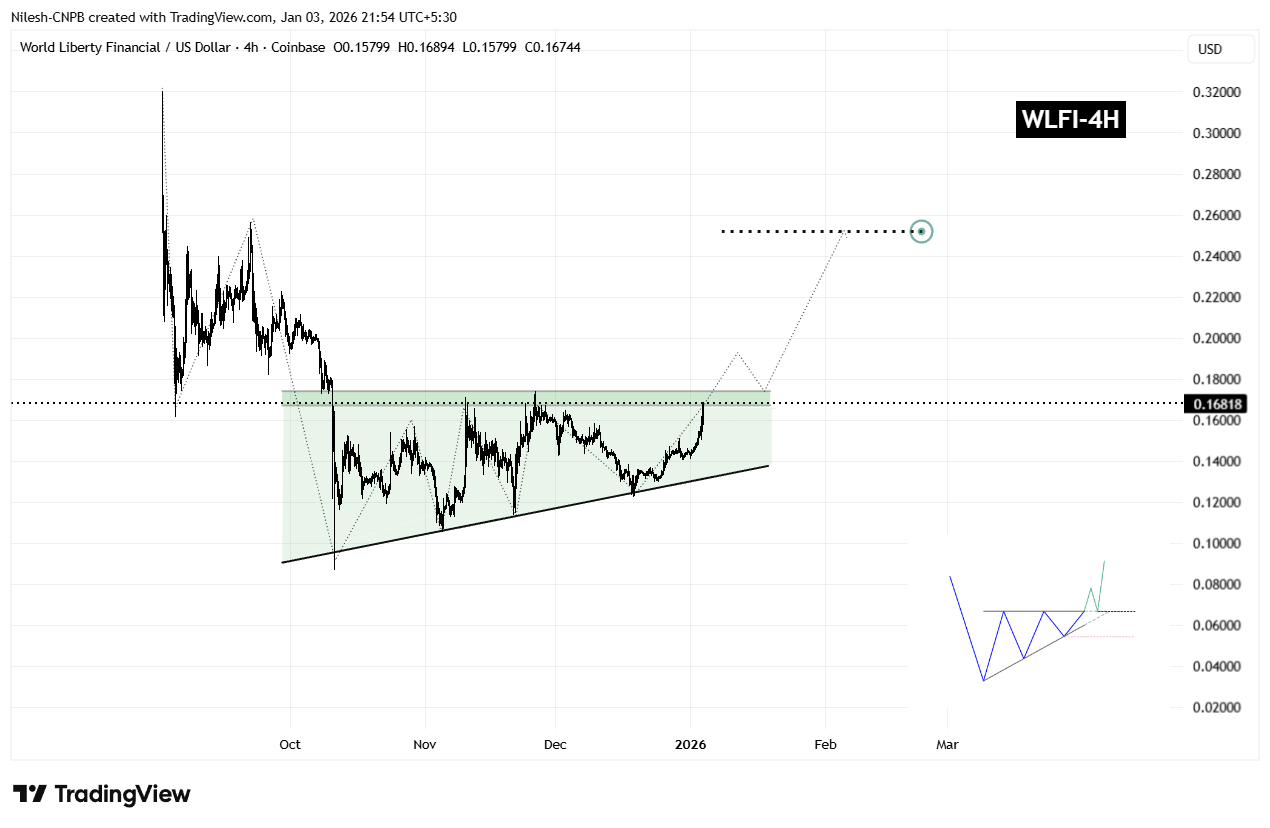
WLFI 4H Chart/Coinsprobe (Source: Tradingview)
The latest rebound has once again carried WLFI toward the upper boundary of the triangle, reinforcing the idea that demand remains firm. Rather than signaling weakness, this sideways-to-higher price action reflects healthy consolidation as volatility tightens ahead of a potential breakout.
What’s Next for WLFI?
From here, WLFI appears poised for another test of the $0.1741 resistance. A decisive breakout above this level, followed by a sustained close and a successful retest as support, would confirm the ascending triangle pattern and likely trigger a broader bullish expansion phase.
Based on the measured move of the formation, the technical upside projection points toward the $0.2522 region. This target represents a potential upside of roughly 48% from current levels and also aligns with prior price structure, strengthening the bullish case.
That said, caution remains warranted. If WLFI fails to break above resistance, price could once again rotate back toward the rising support trendline. As long as this trendline continues to hold, the broader bullish structure remains intact. A decisive breakdown below ascending support, however, would invalidate the pattern and delay any breakout scenario.
For now, the combination of improving market sentiment, steady accumulation, and a tightening ascending triangle suggests that WLFI is approaching a critical inflection point — one that could define its next major move as the new year unfolds.
Disclaimer: The views and analysis presented in this article are for informational purposes only and reflect the author’s perspective, not financial advice. Technical patterns and indicators discussed are subject to market volatility and may or may not yield the anticipated results. Investors are advised to exercise caution, conduct independent research, and make decisions aligned with their individual risk tolerance.
About Author: Nilesh Hembade is the Founder and Lead Author of Coinsprobe, with over 5 years of experience in the cryptocurrency and blockchain industry. Since launching Coinsprobe in 2023, he has been providing daily, research-driven insights through in-depth market analysis, on-chain data, and technical research.
Disclaimer: The information on this page may come from third parties and does not represent the views or opinions of Gate. The content displayed on this page is for reference only and does not constitute any financial, investment, or legal advice. Gate does not guarantee the accuracy or completeness of the information and shall not be liable for any losses arising from the use of this information. Virtual asset investments carry high risks and are subject to significant price volatility. You may lose all of your invested principal. Please fully understand the relevant risks and make prudent decisions based on your own financial situation and risk tolerance. For details, please refer to
Disclaimer.
Related Articles
BTC 15-minute decline of 0.60%: key support broken, combined with leverage deleveraging triggering short-term selling pressure
2026-03-11 17:30 to 2026-03-11 17:45 (UTC), BTC's 15-minute return decreased by -0.60%, with prices fluctuating between 70515.2 and 71317.0 USDT, with an amplitude of 1.13%. Trading volume significantly increased compared to the previous period, with selling pressure dominating, short-term market volatility intensifying, and market attention heating up.
The main driver of this anomaly was BTC losing the key support zone at $68,000-$68,200, triggering algorithmic trading sell-offs and stop-loss orders to be released in concentration, leading to a short-term decline. Meanwhile,
GateNews38m ago
Polkadot Holds $1.46 Support as Descending Channel Caps Upside Near $1.53
The heaviest resistance is at the 4-hour chart where DOT trades within a downward channel and resistance levels are formed near the levels of $1.50-$1.53.
The nearest support is at $1.46 and a more profound zone of demand is at the range of $1.38 to $1.40.
Even with a 1.5 price drop, DOT
CryptoNewsLand51m ago
SOL Consolidates Near $84 While Chart Highlights Possible $45 Demand Zone
Solana (SOL) trades at $83.87 within a range defined by $81.03 support and $84.43 resistance, showing consolidation below a $90 supply zone. There is a broader demand area near $45, indicating potential downward movement before recovery.
CryptoNewsLand55m ago
XRP Eyes $3 As Bollinger Band Squeezes, Setting Stage for Massive 217% Price Spike
In the volatile cryptocurrency landscape, the XRP coin is drawing investor interest for its ability to spur liquidity-driven moves. Today, market analyst Ali Martinez examined the latest chart trajectory of XRP and disclosed a Bollinger Band squeeze that suggests that the market is building for a
BlockChainReporter1h ago
PEPE Stalls at $0.053354 While Oscillators Drift Below 40 Inside Tight Trading Band
PEPE fell to 2.4 per cent to trade at a price of $0.053354 but above the level of support in the vicinity of $0.053325.
Momentum indicators are tight and oscillator values are close to 39.47 and 36.73 and MACD is close to zero line.
The intra-day range of $0.053325 to $0.053473 is still r
CryptoNewsLand1h ago
'Black Swan' Author Nassim Taleb Believes Elon Musk's X Money is 'Much Smarter' Than Bitcoin - U.Today
Elon Musk's X Money will enter early access in April, with Nassim Taleb praising it as a superior alternative to Bitcoin. He argues it promotes competition in currency issuance, functional daily use, and is backed by a robust infrastructure, unlike volatile cryptocurrencies.
UToday2h ago