
ENA is starting to show a few signs of life, and the chart shared by Sjuul fits well with the idea of a “power of 3” setup. After several weeks of weakness, ENA could be on the cusp of shifting from a base-building phase to a more constructive phase.
Right now, the ENA price is trading around $0.22, though the key question revolves around testing a critical support point.
- ENA Is Trying to Build a Base After a Long Slide
- This Support Level Is Doing the Heavy Lifting
- What’s Next for ENA?
ENA Is Trying to Build a Base After a Long Slide
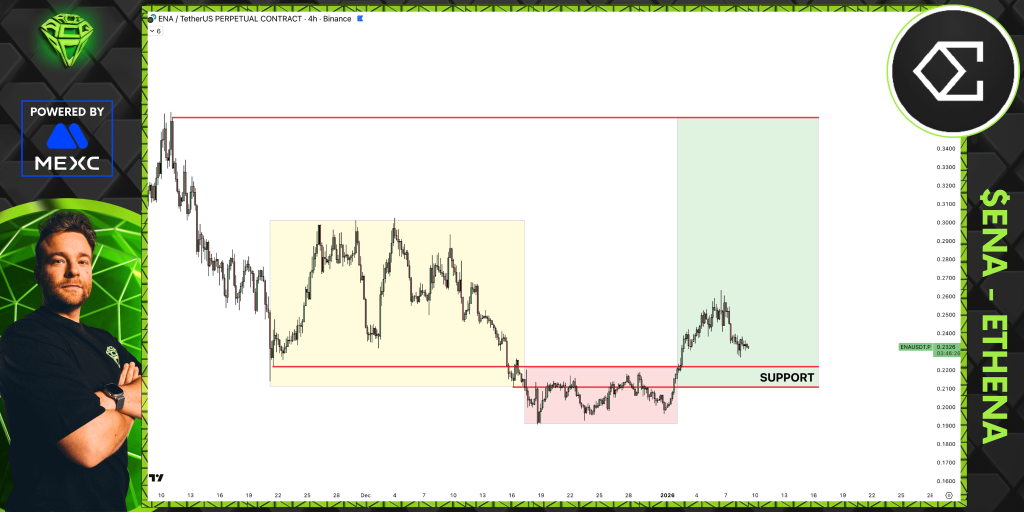
Looking at the left side of the chart shared by Sjuul, the ENA price spent a long time drifting lower before settling into a messy, choppy range. That yellow zone highlights a stretch where price moved sideways before eventually breaking down.
After that drop, ENA started forming a base in the lower range, with price repeatedly testing the same area and failing to push much lower. That kind of action often shows sellers are losing control.
Source: X/@AltCryptoGems
Then the structure shifted. The ENA price pushed back above support and made a sharp move higher into the green zone. Since that pop, price has pulled back, but the important thing is that it hasn’t given the move back entirely. That’s usually what bulls want to see if a recovery is going to stick.
Here Are $XRP Price Predictions for The End of 2026._**
This Support Level Is Doing the Heavy Lifting
The support zone in the low-$0.22 area is the level that matters most right now. It’s where resistance turned into support after the rebound, and it’s acting as the line in the sand. As long as ENA keeps holding above this level, the setup stays intact.
If that support fails, the chart starts to look a lot weaker. A break below it would likely send the
ENA price back toward $0.21 or even into the high-$0.19 range, where the earlier base formed. That would turn the recent move into a failed breakout.
What’s Next for ENA?
On the bullish side, the ENA price holds support and starts putting in higher lows. That would keep the expansion phase in play. The first area to watch is around $0.25 to $0.26, which lines up with the recent swing high.
If ENA can get back above that zone and hold it, the path opens toward the upper $0.20s, with the broader range resistance sitting much higher near $0.34.
If momentum doesn’t show up, a more neutral outcome is possible. In that case, ENA could stay stuck between the low-$0.22 support and resistance near $0.25, chopping sideways until the market makes up its mind.
So, where is the ENA price headed next? For this ENA price prediction, it really comes down to one thing. As long as support holds, ENA has a real shot at expanding higher. If it doesn’t, the chart likely slides back into consolidation.
Disclaimer: The information on this page may come from third parties and does not represent the views or opinions of Gate. The content displayed on this page is for reference only and does not constitute any financial, investment, or legal advice. Gate does not guarantee the accuracy or completeness of the information and shall not be liable for any losses arising from the use of this information. Virtual asset investments carry high risks and are subject to significant price volatility. You may lose all of your invested principal. Please fully understand the relevant risks and make prudent decisions based on your own financial situation and risk tolerance. For details, please refer to
Disclaimer.
Related Articles
XRP Holds $1.34 Support While Leverage Heatmap Highlights $1.30 Risk Zone
XRP is trading at $1.36 in a tight range of support at $1.34 and resistance at $1.37.
The heatmap data indicates that there is a huge amount of long positions in the range of $1.30.
Should prices fall to around $1.30, long positions with high leverage in this region might
CryptoNewsLand3m ago
Crypto Market Update – River and Hyperliquid Lead Gainers As Decentralized Infrastructure Gains M...
The crypto market is displaying its typical volatility once again, yet under the noise of price movements, the beginnings of a narrative are starting to take shape. As of today, the “Top Gainers” on CoinMarketCap leans heavily towards projects targeting decentralized infrastructure and fast Layer-1s
BlockChainReporter38m ago
Solana Approaches Key Sell Wall at $84.78 — Will Momentum Hold for a Move Toward $89?
Solana is trading at an approximate price of $83.18, although a solid sell wall is at an approximate price of $84.78, which prevents upward movement.
The price is trapped between the support at $81.99 and the resistance at $84.78 which is short term consolidation.
Once buyers hit the
CryptoNewsLand1h ago
SOL Consolidates Near $84 While Chart Highlights Possible $45 Demand Zone
Solana (SOL) trades at $83.87 within a range defined by $81.03 support and $84.43 resistance, showing consolidation below a $90 supply zone. There is a broader demand area near $45, indicating potential downward movement before recovery.
CryptoNewsLand1h ago
Santiment: The surge in active USDT addresses on a certain public blockchain is correlated with the rebound of BTC
Research firm Santiment found that over the past year, when USDT active addresses on a certain public blockchain surged three times, BTC price rebounded each time, indicating that USDT liquidity has a significant impact on BTC price.
GateNews2h ago
PEPE Consolidates Above $0.05324 Support as Momentum Strengthens and Resistance Near $0.05336 Holds
PEPE has a tight intraday price compression with a support level of $0.053243 and resistance level of $0.053363.
A RSI of 64.13 represents the moderate bullish momentum whereas MACD history is slightly positive, which indicates the gradual buying momentum.
The price is at $0.053364
CryptoNewsLand2h ago