Pump.fun (PUMP) has been cooling off during the past 3 days, yet the broader structure on the chart suggests the story may not be finished. Price action shows that PUMP had already recorded more than an 80% rise before the recent pullback, which makes the current pause look more like a breather than a breakdown. That slow but upward move that began toward the end of December is still visible when the chart is viewed as a whole.
Early price behavior matters here. PUMP spent weeks drifting lower before finding a base near the $0.0020 area. From that zone, price began forming higher lows, followed by a gradual push upward. The recent decline has not erased that structure, which is why this cooling phase is drawing attention rather than concern.
Pump.fun Price Analysis Shows A Shift After Long Term Downtrend Break
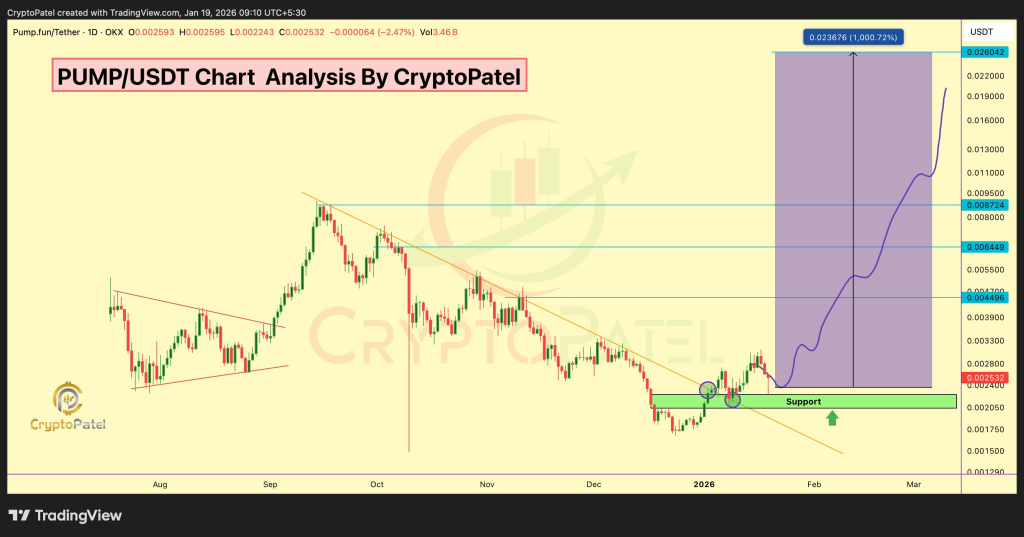
A closer look at the daily chart highlights a major technical shift. Pump.fun price recently moved above a long-term descending trendline that had capped upside attempts for months. That break often changes how a market behaves, since former resistance can start acting as support.
According to Crypto Patel, this break places PUMP inside what he describes as a bullish expansion zone. His analysis points to a completed distribution and correction phase, followed by early reversal signals. That interpretation lines up with the chart, where price stopped making lower lows and began stabilizing above the $0.0020 level.
@CryptoPatel / X
The attached chart also shows a descending wedge structure that resolved to the upside. That pattern often appears near the end of corrective phases, especially when volume starts to improve and downside momentum fades.
PUMP Price Holds Key Demand Zone That Supports Bullish Structure
One of the most important areas on the chart sits between $0.0020 and $0.0022. That zone has acted as a strong demand region, with multiple tests that failed to push price decisively lower. Each successful hold adds weight to the idea of accumulation rather than distribution.
Crypto Patel emphasizes that PUMP price remaining above $0.0020 keeps the bullish bias intact. The chart supports this view, since price has reclaimed support levels that previously acted as resistance. Those reclaims often signal that buyers are willing to step in earlier than before.
Why Bittensor (TAO) Could Be One of the Most Important AI Cryptos Ever Built_**
When projecting forward, the chart highlights several technical levels that stand out. Crypto Patel outlines upside zones around $0.00872, $0.015, and $0.026. From current levels, those targets imply a potential 500% to 1000% move if momentum continues building.
That potential does not come without risk, which is why the invalidation point matters. A daily close below $0.0020 would weaken the bullish structure and challenge the current PUMP price prediction. Until that happens, the chart continues to favor higher levels over time.
Disclaimer: The information on this page may come from third parties and does not represent the views or opinions of Gate. The content displayed on this page is for reference only and does not constitute any financial, investment, or legal advice. Gate does not guarantee the accuracy or completeness of the information and shall not be liable for any losses arising from the use of this information. Virtual asset investments carry high risks and are subject to significant price volatility. You may lose all of your invested principal. Please fully understand the relevant risks and make prudent decisions based on your own financial situation and risk tolerance. For details, please refer to
Disclaimer.
Related Articles
鏈上熱到爆、以太幣卻漲不動?專家揭「致命死穴」:恐下探 1,500 美元
CryptoQuant 報告指出,以太坊面臨「採用悖論」,雖然網路活躍度創新高,但幣價卻下滑。若熊市持續,到第三季末以太幣可能跌至 1,500 美元。智能合約活躍度上升與以太幣價格脫鉤,交易所流入量更能反映價格動態。投資需求疲軟,資金持續流失是主要隱憂。
区块客29m ago
Dogecoin (DOGE) phát tín hiệu khởi sắc khi dòng tiền nhà đầu tư cá nhân quay lại
Dogecoin (DOGE) is experiencing a recovery, currently up over 2% and nearing the psychological $0.1000 mark. Increased speculative activity is attracting traders to the derivatives market, and technical indicators suggest a cautious positive outlook for DOGE.
TapChiBitcoin39m ago
DePIN and AI Lead the Charge – Analyzing the Top Weekly Crypto Gainers
The cryptocurrency market serves as an indicator for new technological trends, and weekly data for the cryptocurrency market collected by CoinMarketCap show that investor sentiment has recently changed a lot. The market remains directionless overall, yet an exclusive set of projects, particularly in
BlockChainReporter39m ago
Liệu RAVE có sẵn sàng tăng 30% sau khi lấy lại được mức hỗ trợ này?
RaveDAO (RAVE) hiện đang giao dịch ở mức $0,2475 sau khi ghi nhận mức tăng ấn tượng 16,45%. Đáng chú ý, sự gia tăng mạnh mẽ trong hoạt động thị trường đã được ghi nhận, với khối lượng giao dịch tăng vọt 125%, đạt $88,15 triệu. Điều này phản ánh sự quan tâm lớn từ các nhà đầu tư và nhà giao dịch đối
TapChiBitcoin1h ago
+112 Billion Shiba Inu (SHIB) in 24 Hours Returns Notorious 80 Trillion Threshold - U.Today
Shiba Inu finally recovering
Shiba Inu are ready to sell
More than 112 billion SHIB tokens were transferred to exchanges in the past day, bringing total exchange reserves back above the 80 trillion SHIB threshold, indicating a discernible change in Shiba Inu's on-chain dynamics.
Shiba Inu final
UToday1h ago
Solana Tests $90 Resistance as Fibonacci Confluence Signals Key Turning Point
Key Insights
Solana price is nearing a major resistance near $90 where Fibonacci retracement and value area levels align, creating a decisive technical barrier.
Market structure shows the rally forming part of an ABC corrective pattern, keeping the broader consolidation intact while price tr
CryptoFrontNews2h ago