Solana (SOL) continues to plummet 3% in Monday’s trading session, extending a 4% decline from Sunday, amid escalating tensions between the US and Europe related to Greenland. Derivatives market data reflect a bearish trend, in line with the overall market correction, warning that SOL may still have room to fall. Technically, momentum indicators show increased selling pressure, sending clear sell signals.
Market Sentiment Favors Weakening of Solana Amid Market Tensions
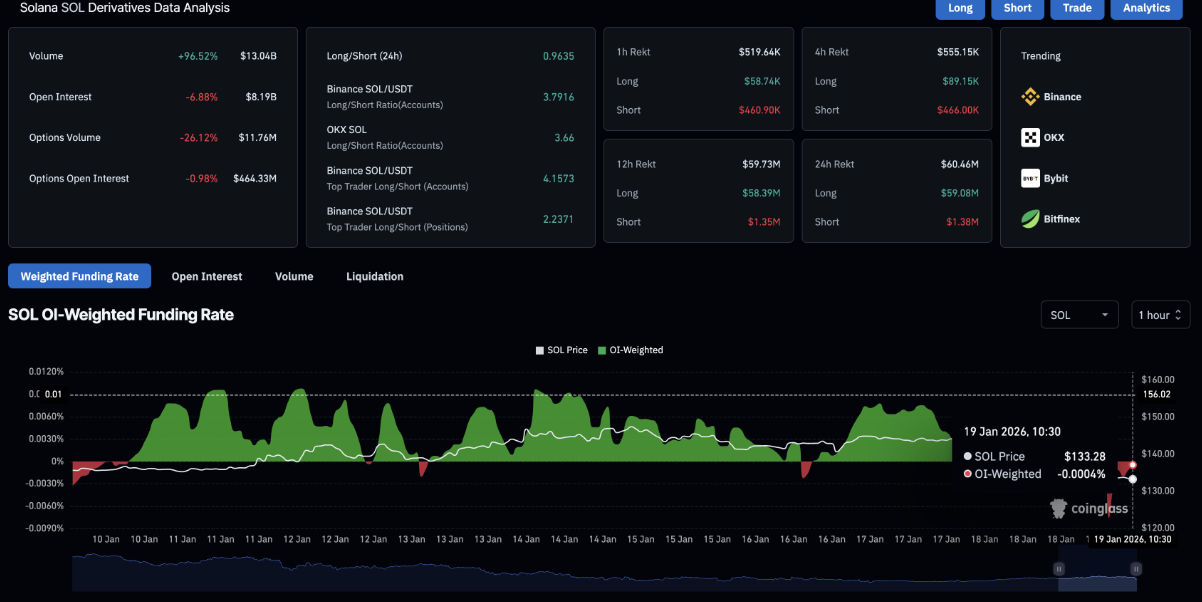
In the past 24 hours, Solana derivatives market experienced a strong liquidation wave for long positions (long), totaling $59.08 million, many times higher than the $1.38 million liquidated from short positions (short), clearly reflecting selling pressure dominating the market. At the same time, open interest (OI) in SOL futures contracts decreased by about 7%, down to $8.19 billion, consistent with the liquidation of long positions, indicating cautious sentiment and reduced risk appetite among traders.
The funding rate at -0.0004% further reinforces the bearish trend, as traders continue to establish new positions cautiously.
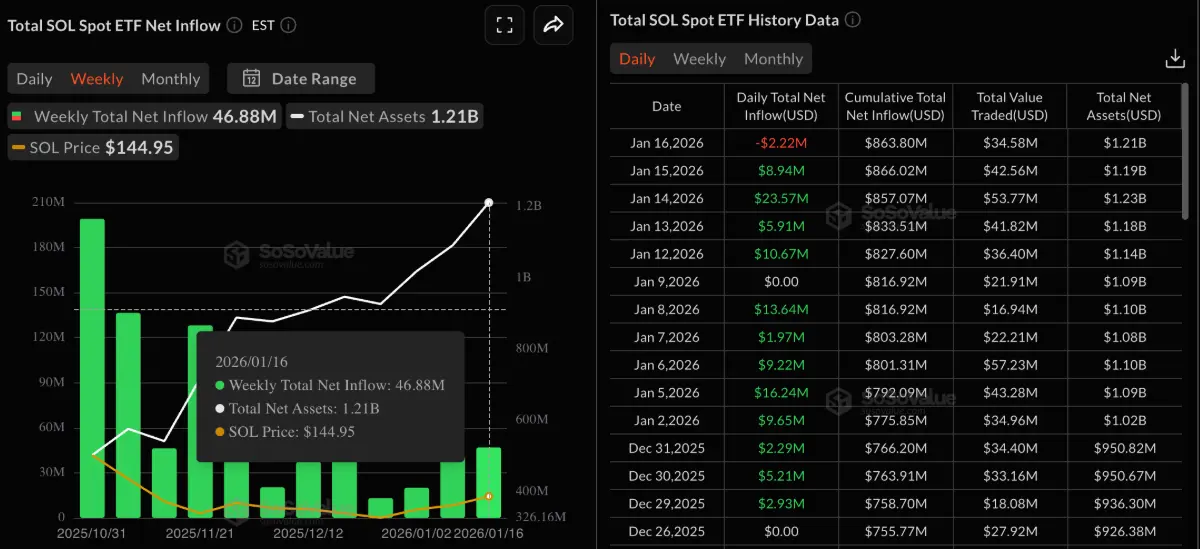
 Source: CoinGlass From an institutional investor perspective, Solana ETF funds (SOL) in the US still recorded $46.88 million in inflows last week. However, changes in market dynamics could diminish confidence, potentially increasing selling pressure on Tuesday. It is worth noting that the US market was closed on Monday for Martin Luther King Jr. Day, adding uncertainty to the early-week trading rhythm.
 Source: Sosovalue## Technical Outlook: Will Solana’s Price Drop to December Lows?
Solana continues to face significant selling pressure as the price hovers around $130, below both the 20-day and 50-day EMA at the $137–138 range. This movement indicates that the short-term downtrend remains dominant. If the momentum weakens further, the price structure risks breaking the rounded bottom pattern formed from the low of $116 on 12/18, increasing the risk of a deeper correction.
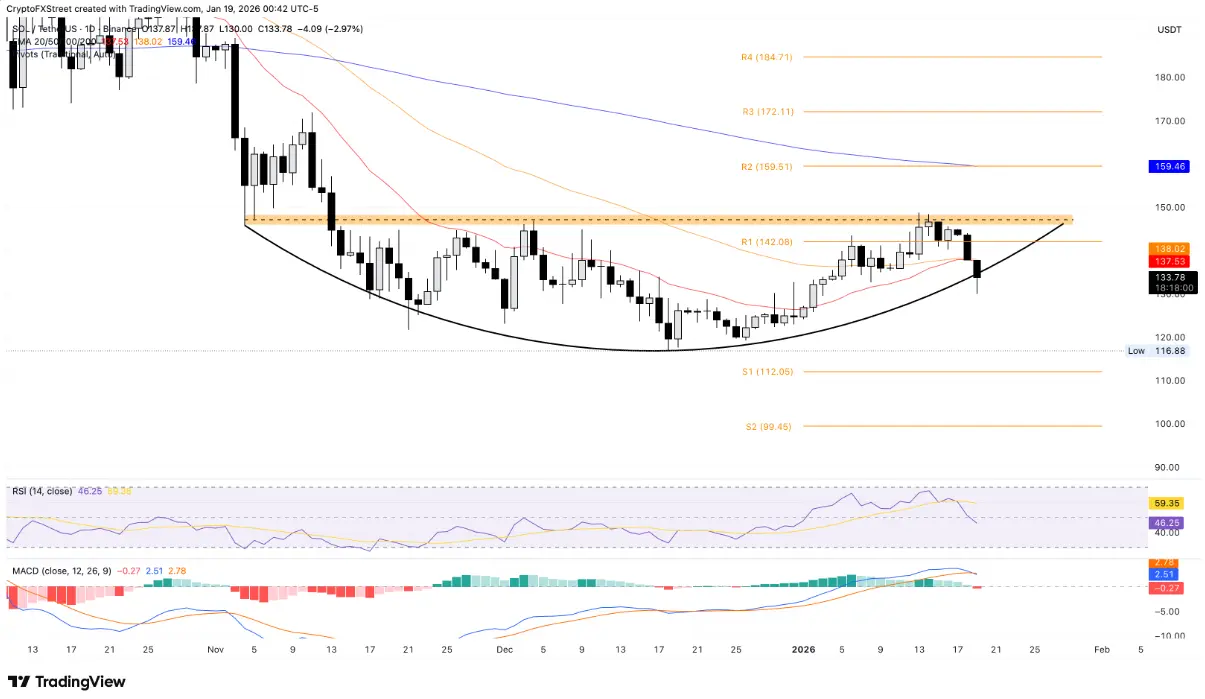 Daily SOL/USDT Chart | Source: TradingView On the daily timeframe, the MACD indicator has crossed below the signal line, with the histogram turning negative, reflecting increasing bearish momentum. Meanwhile, RSI has retreated to around 45 and fallen below the neutral threshold of 50, further supporting the scenario of rising selling pressure.
Conversely, the nearest resistance zone is around the $148 supply area. If the price can break through and hold above this level, Solana is likely to open up room for recovery toward the 200-day EMA, around $159.
Disclaimer: The information on this page may come from third parties and does not represent the views or opinions of Gate. The content displayed on this page is for reference only and does not constitute any financial, investment, or legal advice. Gate does not guarantee the accuracy or completeness of the information and shall not be liable for any losses arising from the use of this information. Virtual asset investments carry high risks and are subject to significant price volatility. You may lose all of your invested principal. Please fully understand the relevant risks and make prudent decisions based on your own financial situation and risk tolerance. For details, please refer to
Disclaimer.