
Key Takeaways
-
SKY is forming a rounding bottom pattern on the daily chart
-
Price has rebounded strongly from the $0.0419 demand zone
-
Rising volume supports improving bullish momentum
-
A breakout above $0.0778 could confirm trend reversal
-
Pattern projection points toward the $0.11 region
Sky (SKY), the native governance and utility token of the Sky Protocol (formerly MakerDAO), has stepped into the spotlight after posting a strong daily move of over 8%, accompanied by a sharp 35% surge in trading volume. While the short-term momentum is drawing attention, the more compelling story is unfolding on the higher timeframe chart.
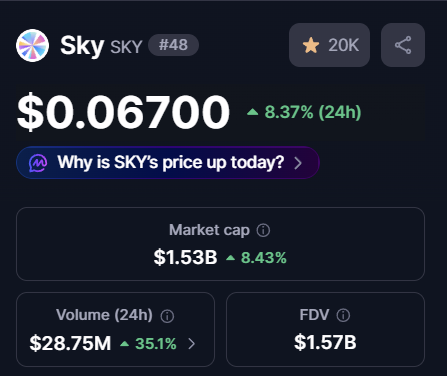
Source: Coinmarketcap
Price action is now forming a classic bullish reversal structure — one that often signals the transition from prolonged weakness into a new recovery phase.
Rounding Bottom Pattern Signals Trend Shift
On the daily timeframe, SKY appears to be completing a rounding bottom formation, a well-known bullish reversal pattern that typically develops after extended downtrends. This structure reflects a gradual shift in market psychology, where persistent selling pressure slowly fades and long-term accumulation begins to dominate.
Earlier in the trend, SKY faced repeated rejection near the $0.0778 neckline resistance, which triggered a steep sell-off. That decline ultimately bottomed near $0.0419, marking a critical demand zone where buyers aggressively stepped in and prevented further downside.
Since establishing this low, price action has steadily curved higher, forming a smooth rounded base. This gradual recovery — rather than a sharp V-shaped bounce — suggests healthier accumulation rather than short-term speculation.
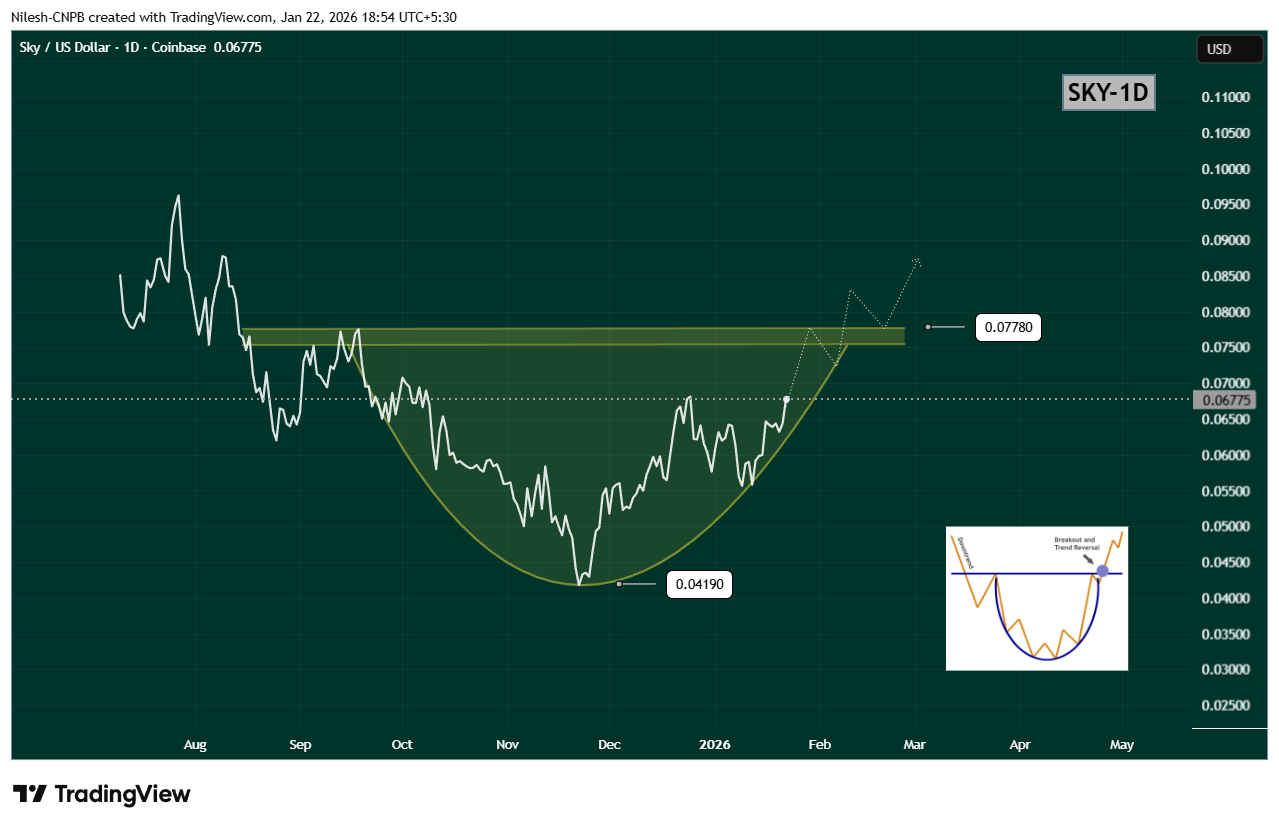
$SKY Daily Chart/Coinsprobe (Source: Tradingview)
Breakout Zone Comes Into Focus
Recent price action shows SKY reclaiming the $0.06933 region, a level that previously acted as resistance. This move strengthens the bullish structure and signals that buyers are gaining confidence ahead of a potential neckline test.
The key level to watch now is the $0.0778 resistance zone. A decisive daily close above this level would confirm the rounding bottom breakout and mark a clear shift in trend structure. Ideally, a breakout followed by a successful retest of this zone as support would further validate the bullish case.
Upside Projection and Risk Outlook
Based on the depth of the rounding bottom, the measured upside projection points toward the $0.11 region. Reaching this target would represent a potential 60–65% upside from current levels, aligning well with historical behavior of similar reversal patterns.
That said, patience remains important. Before any confirmed breakout, SKY could still experience short-term pullbacks or consolidation near the rising curve of the pattern. Such moves would not invalidate the bullish setup, as long as price continues to hold above recent higher lows.
A breakdown below the rounding base would weaken the structure, but for now, momentum favors the bulls.
Bottom Line
SKY is showing clear signs of a trend reversal in progress, with a rounding bottom pattern taking shape on the daily chart. Rising volume, improving structure, and a steady recovery toward neckline resistance all suggest that accumulation is underway.
If SKY can break and hold above $0.0778, the path opens toward the $0.11 region, signaling a broader bullish continuation. Until then, consolidation and minor pullbacks remain possible — but the overall structure is one that traders will be watching closely.
Disclaimer: The views and analysis presented in this article are for informational purposes only and reflect the author’s perspective, not financial advice. Technical patterns and indicators discussed are subject to market volatility and may or may not yield the anticipated results. Investors are advised to exercise caution, conduct independent research, and make decisions aligned with their individual risk tolerance.
About Author: Nilesh Hembade is the Founder and Lead Author of Coinsprobe, with over 5 years of experience in the cryptocurrency and blockchain industry. Since launching Coinsprobe in 2023, he has been providing daily, research-driven insights through in-depth market analysis, on-chain data, and technical research.
Disclaimer: The information on this page may come from third parties and does not represent the views or opinions of Gate. The content displayed on this page is for reference only and does not constitute any financial, investment, or legal advice. Gate does not guarantee the accuracy or completeness of the information and shall not be liable for any losses arising from the use of this information. Virtual asset investments carry high risks and are subject to significant price volatility. You may lose all of your invested principal. Please fully understand the relevant risks and make prudent decisions based on your own financial situation and risk tolerance. For details, please refer to
Disclaimer.
Related Articles
'Black Swan' Author Nassim Taleb Believes Elon Musk's X Money is 'Much Smarter' Than Bitcoin - U.Today
Elon Musk's X Money will enter early access in April, with Nassim Taleb praising it as a superior alternative to Bitcoin. He argues it promotes competition in currency issuance, functional daily use, and is backed by a robust infrastructure, unlike volatile cryptocurrencies.
UToday28m ago
ETH 15-minute decline of 0.80%: On-chain large fund flows and DEX selling pressure resonate to trigger a downtrend
2026-03-11 15:00 to 2026-03-11 15:15 (UTC), ETH price briefly and rapidly declined within the range of 2042.35 to 2065.57 USDT, with a K-line return of -0.80% and an amplitude of 1.13%. Market volatility intensified during this period, with significantly increased attention, and short-term market pressure triggered market alertness.
The main driving force behind this anomaly is large-scale on-chain fund flows and sell pressure concentrated on decentralized exchanges (DEX). Monitoring data shows multiple large ETH transfers to trading platforms, suspected to involve institutions or whales.
GateNews48m ago
XRP Price Hints at Bullish Reversal as Negative Funding Rates Build Pressure on Short Sellers
XRP shows potential for a bullish reversal as market indicators align, with negative funding rates possibly triggering a short squeeze. Technical patterns and whale accumulation further support an upward move, indicating a significant price change may be imminent.
CryptometerIo1h ago
Shiba Inu (SHIB) regains momentum as buying pressure reaches the highest level of the month
The price of Shiba Inu (SHIB) is fluctuating around the 0.0000056 USD mark at the time of writing on Wednesday, after rising nearly 7% over the past two days. This recovery trend appears as on-chain indicators and derivatives market data begin to send positive signals. Trading volume is increasing.
TapChiBitcoin1h ago
Goldman Sachs: Hedge fund positioning may create conditions for a rebound in US stocks, with short positions rising to the highest since September 2022
Goldman Sachs report indicates that the structure of hedge fund positions in the US stock market is creating conditions for a market rebound. Speculators maintain long positions while shorting ETFs and futures. Short positions have reached their highest level since September 2022, reflecting market responses to uncertainty. If positive news emerges, it could trigger a rapid market rally.
GateNews2h ago
ETH 15-minute increase of 0.83%: Whales' capital inflow and DeFi lending demand resonate to drive the price
Between 13:30 and 13:45 (UTC) on March 11, 2026, ETH experienced a short-term fluctuation. The candlestick data shows a return of +0.83%, with a price range of 2046.07 to 2082.31 USDT, and an amplitude of 1.77%. Market activity increased during this period, with trading volume significantly higher than the previous cycle, and volatility exceeding the intraday average, attracting widespread market attention.
The main drivers of this fluctuation were the rapid inflow of large on-chain funds and active institutional accounts. Between 13:32 and 13:43,
GateNews2h ago