
Key Takeaways
The broader cryptocurrency market has once again slipped into a corrective phase after a strong start to the year. Bitcoin (BTC), which recently surged above the $95,000 mark, has pulled back sharply and is now trading below $88,000. Ethereum (ETH) has faced even heavier pressure, sliding more than 10% over the past week — a move that has weighed on major altcoins across the board.
Pudgy Penguins (PENGU) hasn’t been spared either. The token is currently down around 7% on the week. However, beneath the surface, PENGU’s price action is beginning to show a familiar and potentially bullish setup — one that closely resembles PEPE’s structure before its explosive breakout.
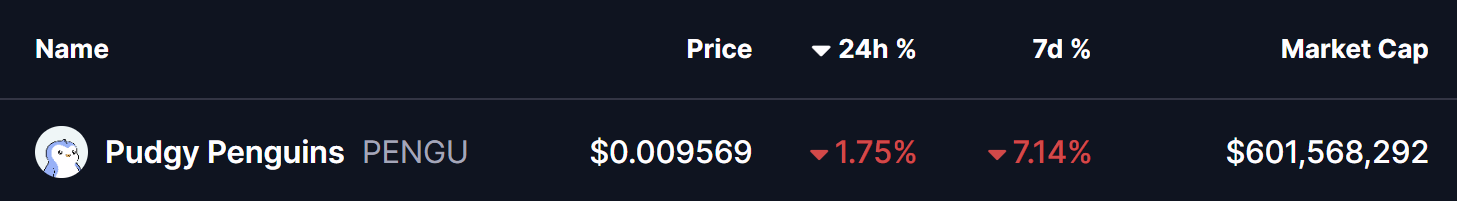
Source: Coinmarketcap
PENGU Mirrors PEPE’s Pre-Rally Structure
A side-by-side comparison of the PEPE and PENGU charts reveals striking similarities.
Back in late 2024, PEPE went through a sharp decline that eventually led to a bottoming formation. During this phase, price consolidated for an extended period inside a gray accumulation zone while forming a potential bearish Butterfly harmonic pattern. At the time, sentiment was muted and volatility remained compressed.
Once PEPE finally broke above that gray range, momentum flipped aggressively. The breakout triggered a powerful bullish reversal, sending PEPE more than 100% higher into December 2024.
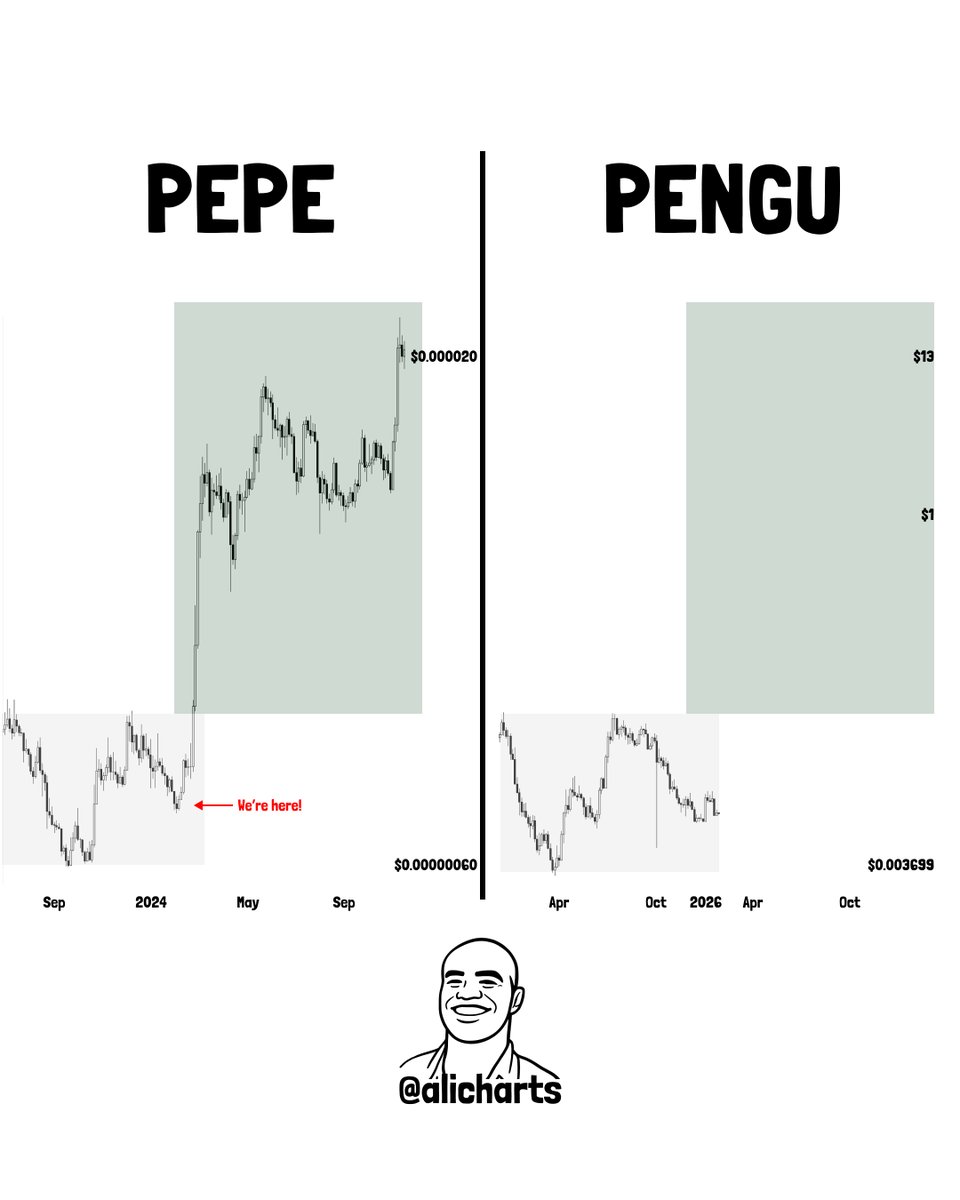
PEPE and PENGU Fractal Chart/Credits: @alicharts (X)
Now, PENGU appears to be following a remarkably similar path.
As shown on the right side of the chart, PENGU has also experienced a strong drop followed by a basing structure inside a gray consolidation zone. The price action suggests a potential bearish Butterfly harmonic pattern forming near the bottom — a setup that closely mirrors PEPE’s behavior just before its reversal.
What’s Next for PENGU?
If the PEPE fractal continues to play out, PENGU may be approaching the early stages of a trend reversal.
A decisive breakout above the gray zone resistance near $0.01382 would be a key confirmation signal. Such a move could open the door for a bullish continuation toward higher levels, with a potential upside target near $0.034, similar to PEPE’s post-breakout expansion.
That said, fractals are not guarantees — they are historical analogs, not certainties.
On the downside, a sustained drop below the $0.0084 support level would invalidate the fractal comparison and suggest that PENGU needs more time to build a durable base before any meaningful upside can materialize.
For now, PENGU sits at a technical crossroads. While broader market weakness continues to apply pressure, the chart hints that smart money may be quietly positioning ahead of a possible reversal. If momentum returns and the gray zone gives way, Pudgy Penguins could be setting up for its next major move — just as PEPE once did.
Disclaimer: The views and analysis presented in this article are for informational purposes only and reflect the author’s perspective, not financial advice. Technical patterns and indicators discussed are subject to market volatility and may or may not yield the anticipated results. Investors are advised to exercise caution, conduct independent research, and make decisions aligned with their individual risk tolerance.
About Author: Nilesh Hembade is the Founder and Lead Author of Coinsprobe, with over 5 years of experience in the cryptocurrency and blockchain industry. Since launching Coinsprobe in 2023, he has been providing daily, research-driven insights through in-depth market analysis, on-chain data, and technical research.
Disclaimer: The information on this page may come from third parties and does not represent the views or opinions of Gate. The content displayed on this page is for reference only and does not constitute any financial, investment, or legal advice. Gate does not guarantee the accuracy or completeness of the information and shall not be liable for any losses arising from the use of this information. Virtual asset investments carry high risks and are subject to significant price volatility. You may lose all of your invested principal. Please fully understand the relevant risks and make prudent decisions based on your own financial situation and risk tolerance. For details, please refer to
Disclaimer.
Related Articles
1.7 Billion Cardano in 24 Hours, ADA Bulls React to Market Sentiment Shift - U.Today
Cardano (ADA) has seen significant trading activity recently, with a drop in price from $0.2682 to $0.2590 amid rising selling pressure and global tensions. Increased selling and market sentiment could challenge ADA's stability, but recent adoption efforts may support recovery if trading volumes rise.
UToday1h ago
Geopolitical Turmoil! Dalio Declares "Gold is the Only True God," but Its Safe-Haven Performance Trails Bitcoin
As geopolitical tensions in the Middle East escalate, Bridgewater founder Ray Dalio questions Bitcoin and reaffirms gold as the preferred safe haven. Nevertheless, gold prices fell accordingly, while Bitcoin only experienced a slight correction, indicating that the correlation between the two is weakening. Dalio doubts Bitcoin's transparency and future risks, but he still maintains a small allocation of Bitcoin for diversification.
区块客2h ago
Interest in altcoins cools down: Can Ethereum trigger a new altcoin season?
The market is forcing investors to bring risk management back to the center.
From a technical perspective, the inflow of funds over the past week has driven
TapChiBitcoin2h ago
Aster Price Nears $0.79 Breakout as Reversal Pattern Strengthens
Key Insights
Aster price structure shows an inverse head and shoulders pattern forming beneath $0.79 resistance, signaling growing buying pressure and possible trend reversal ahead.
Repeated tests of the $0.79 neckline suggest weakening selling pressure as buyers steadily absorb supply
CryptoFrontNews4h ago
The HYPE price could surge despite the upcoming $2.8 million short squeeze.
The recent price movements of Hyperliquid (HYPE) are characterized by stagnation around 30 USD. A symmetrical triangle pattern indicates potential for a breakout in either direction, but market sentiment is cautious. Short squeeze risks may boost prices, while weak market flow and deteriorating demand pose challenges. The token could face significant support levels if it dips below 30 USD. An improved market sentiment could lead to a breakout above 33 USD, sparking recovery momentum.
TapChiBitcoin5h ago
Ethereum Price Holds Key Support: Is $2,200 the Next Test for ETH?
March 6, 2026 7:15 pm EST
TheCoinRepublic7h ago