
Key Takeaways
-
Algorand (ALGO) is consolidating after a 13% decline over the past 60 days, while showing stabilization in the last month.
-
The daily chart reveals a repeating bullish fractal, similar to the setup that triggered ALGO’s 300% rally in November 2024.
-
Price is holding inside a long-term accumulation zone between $0.11 and $0.1530.
-
The 200-day moving average near $0.1912 is acting as key resistance and breakout confirmation level.
-
A successful reclaim of the 200 MA could open the path toward $0.60 and the ascending resistance trendline, while a drop below $0.11 would invalidate the bullish setup.
ALGO, the native token of Algorand’s Layer-1 blockchain, has shown steady but muted momentum over the past 30 days, helping slow down its broader correction. Despite this stabilization, ALGO remains down more than 13% over the last 60 days, keeping sentiment cautious across the market.
That said, when looking beyond short-term price noise, the daily chart is beginning to tell a familiar story. The current structure closely resembles a bullish fractal that, in the past, preceded a powerful breakout rally—raising an important question for traders: is this just consolidation, or a quiet accumulation phase before the next move?
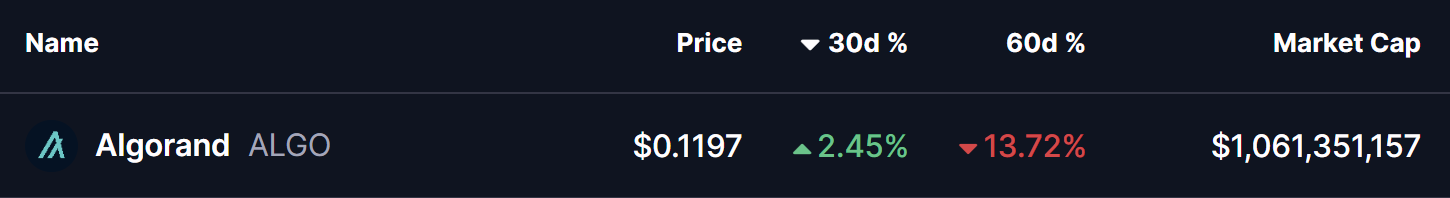
Source: Coinmarketcap
Fractal Setup Hints at a Bullish Reversal
On the daily timeframe, ALGO is displaying early signs of a repeating bullish structure, built around three key technical elements:
-
A rejection from the long-term ascending resistance trendline
-
A prolonged accumulation zone at major historical support
-
A potential reclaim of the 200-day moving average
The current corrective phase began in December 2024, when ALGO was rejected near the ascending resistance trendline around $0.60. That rejection triggered a deep pullback of more than 80%, eventually driving price back into the long-term demand zone between $0.11 and $0.1530—a region that has repeatedly acted as an accumulation area on the chart.
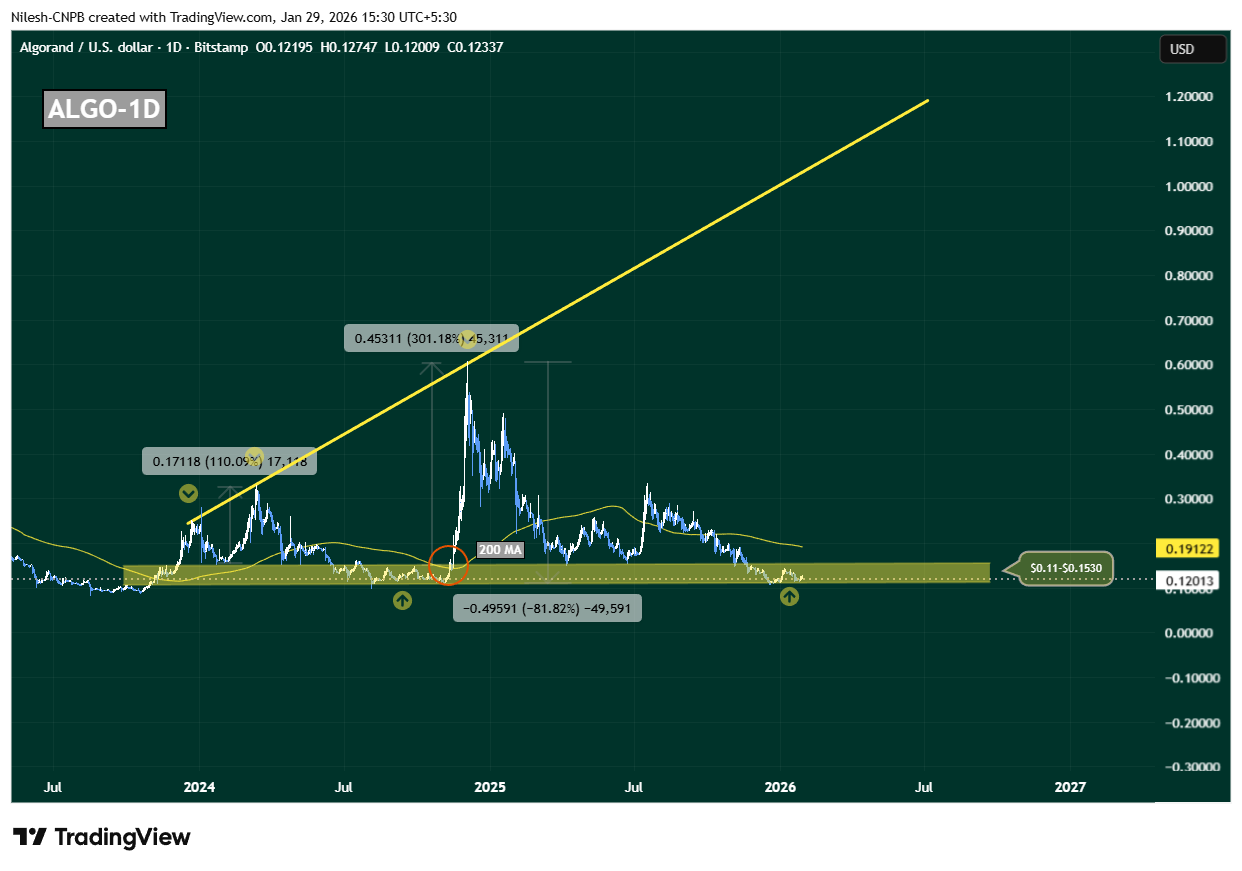
Algorand (ALGO) Daily Chart/Coinsprobe (Source: Tradingview)
This zone is not just technically important; it has also served as a launchpad during previous cycles, where downside momentum stalled and long-term buyers quietly stepped in.
History Rhymes on the ALGO Chart
What makes this setup particularly compelling is how closely it mirrors November 2024’s breakout structure. Back then, ALGO spent extended time consolidating near the same support band before reclaiming the 200-day moving average. Once that level flipped into support, price accelerated sharply—resulting in a 300% rally toward the ascending resistance trendline.
Today, ALGO is once again compressing inside this accumulation range, while the 200-day moving average sits overhead near $0.1912, acting as dynamic resistance. This alignment suggests the market may be approaching another inflection point.
What’s Next for ALGO?
At present, ALGO is hovering near $0.12, firmly inside its long-term accumulation zone. As long as price holds above this region, the broader bullish fractal remains intact.
A clean and sustained reclaim of the 200-day moving average around $0.1912 would be a critical confirmation signal. If bulls manage to flip this level into support, it would closely replicate previous breakout conditions and could trigger a sharp upside expansion. In that scenario, $0.60 becomes a realistic medium-term target, with further upside possible toward the ascending resistance trendline if momentum builds.
However, the structure is not without risk. A decisive breakdown below $0.11 would weaken the accumulation thesis, signal loss of long-term support, and open the door for deeper downside.
For now, ALGO sits at a make-or-break zone. The chart suggests patience is key—but if history repeats, this quiet phase may not last much longer.
Disclaimer: The views and analysis presented in this article are for informational purposes only and reflect the author’s perspective, not financial advice. Technical patterns and indicators discussed are subject to market volatility and may or may not yield the anticipated results. Investors are advised to exercise caution, conduct independent research, and make decisions aligned with their individual risk tolerance.
About Author: Nilesh Hembade is the Founder and Lead Author of Coinsprobe, with over 5 years of experience in the cryptocurrency and blockchain industry. Since launching Coinsprobe in 2023, he has been providing daily, research-driven insights through in-depth market analysis, on-chain data, and technical research.
Disclaimer: The information on this page may come from third parties and does not represent the views or opinions of Gate. The content displayed on this page is for reference only and does not constitute any financial, investment, or legal advice. Gate does not guarantee the accuracy or completeness of the information and shall not be liable for any losses arising from the use of this information. Virtual asset investments carry high risks and are subject to significant price volatility. You may lose all of your invested principal. Please fully understand the relevant risks and make prudent decisions based on your own financial situation and risk tolerance. For details, please refer to
Disclaimer.
Related Articles
XRP Today News: XRP Whale Accumulates 210 Million Tokens, Market Compression Range Indicates a Major Move
XRP has been under continuous pressure this year, but large whales holding between 1 million and 100 million XRP have recently increased their holdings by approximately 210 million coins, indicating that major investors are quietly building positions during the downturn. On the technical side, XRP is forming a contracting wedge between the support at $1.30 and resistance at $1.50, suggesting a potential significant directional move. The low liquidity environment could both amplify gains and increase downside risks. Watching whether the $1.30 support can hold is crucial.
MarketWhisper10m ago
Peter Brandt releases Bitcoin chart analysis showing a short-term bullish pattern
Gate News Announcement, March 10, renowned trader and chart analyst Peter Brandt released a Bitcoin chart analysis. Peter Brandt successfully predicted the 2018 Bitcoin crash. The chart shows the "Big Banana" chart displaying a large upward curved channel on the long-term weekly chart (2014-2027); the "Small Banana" chart shows a smaller similar curve currently forming near $69,000 on the daily chart. The arrows in the chart clearly point upward, indicating higher targets.
GateNews31m ago
ETH 15-minute increase of 1.32%: Major capital inflows and technical rebound resonate to drive the rise
2026-03-10 02:30 to 2026-03-10 02:45 (UTC), ETH's 15-minute return reached +1.32%, with a price range of 2020.97 to 2054.01 USDT, and an amplitude of 1.63%, showing a significant anomaly. Market attention increased accordingly, volatility intensified, and short-term trading activity rose.
The main driver of this anomaly was the concentration of large on-chain funds buying in, especially multiple large wallets making cumulative large purchases of over 3000 ETH near key support levels, directly pushing up the ETH price.
GateNews37m ago
BTC Price Fluctuation Analysis
# BTC Price Movement Deep Attribution Report for March 10, 2026, 02:30-02:45 (UTC)
## 1. Event Overview
Between 02:30 and 02:45 (UTC) on March 10, 2026, Bitcoin (BTC) experienced a significant price movement, with a return of +1.39%. The price fluctuations during this time window exceeded normal ranges, attracting market attention. This report will conduct a comprehensive attribution analysis based on on-chain data, market conditions, macroeconomic environment, trading behaviors, and other dimensions to uncover the true causes of the event and provide insights for investors.
GateNews38m ago
Pi Network price increased by 25% over the week, with bullish momentum continuing strong before Pi Day
Pi Network's token PI has recently experienced a slight increase, with event-driven demand expectations. Technical analysis shows that PI is stable at the key support level of $0.21 and plans to maintain a positive sentiment before Pi Day (March 14), which could drive the price to continue rising. Analysts indicate that PI needs to break through $0.2396 to confirm upward momentum and move toward the 200-day moving average target of $0.2854.
MarketWhisper55m ago
Bitcoin Shows ‘Tentative Signs of Improvement’ as Iran Conflict Fears Wane
In brief
Bitcoin has climbed more than 4% to roughly $69,100 as risk assets steadied after oil retreated from a spike tied to Middle East tensions.
Futures open interest and aggressive buying in perpetual markets suggest traders are cautiously returning to leveraged positions.
U.S. spot B
Decrypt2h ago