
Key Takeaways
-
Algorand (ALGO) is consolidating after a 13% decline over the past 60 days, while showing stabilization in the last month.
-
The daily chart reveals a repeating bullish fractal, similar to the setup that triggered ALGO’s 300% rally in November 2024.
-
Price is holding inside a long-term accumulation zone between $0.11 and $0.1530.
-
The 200-day moving average near $0.1912 is acting as key resistance and breakout confirmation level.
-
A successful reclaim of the 200 MA could open the path toward $0.60 and the ascending resistance trendline, while a drop below $0.11 would invalidate the bullish setup.
ALGO, the native token of Algorand’s Layer-1 blockchain, has shown steady but muted momentum over the past 30 days, helping slow down its broader correction. Despite this stabilization, ALGO remains down more than 13% over the last 60 days, keeping sentiment cautious across the market.
That said, when looking beyond short-term price noise, the daily chart is beginning to tell a familiar story. The current structure closely resembles a bullish fractal that, in the past, preceded a powerful breakout rally—raising an important question for traders: is this just consolidation, or a quiet accumulation phase before the next move?
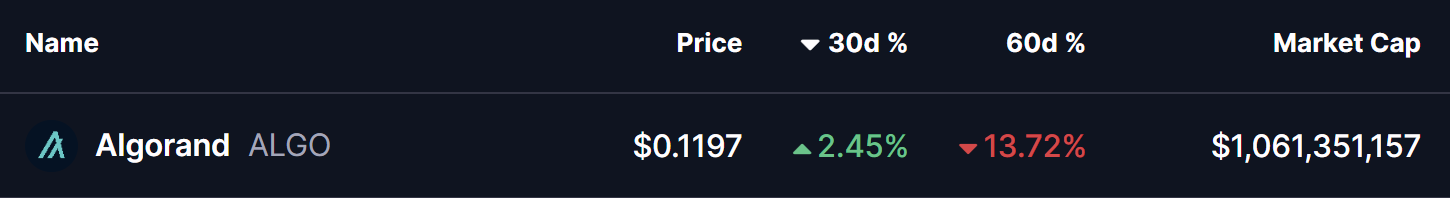
Source: Coinmarketcap
Fractal Setup Hints at a Bullish Reversal
On the daily timeframe, ALGO is displaying early signs of a repeating bullish structure, built around three key technical elements:
-
A rejection from the long-term ascending resistance trendline
-
A prolonged accumulation zone at major historical support
-
A potential reclaim of the 200-day moving average
The current corrective phase began in December 2024, when ALGO was rejected near the ascending resistance trendline around $0.60. That rejection triggered a deep pullback of more than 80%, eventually driving price back into the long-term demand zone between $0.11 and $0.1530—a region that has repeatedly acted as an accumulation area on the chart.
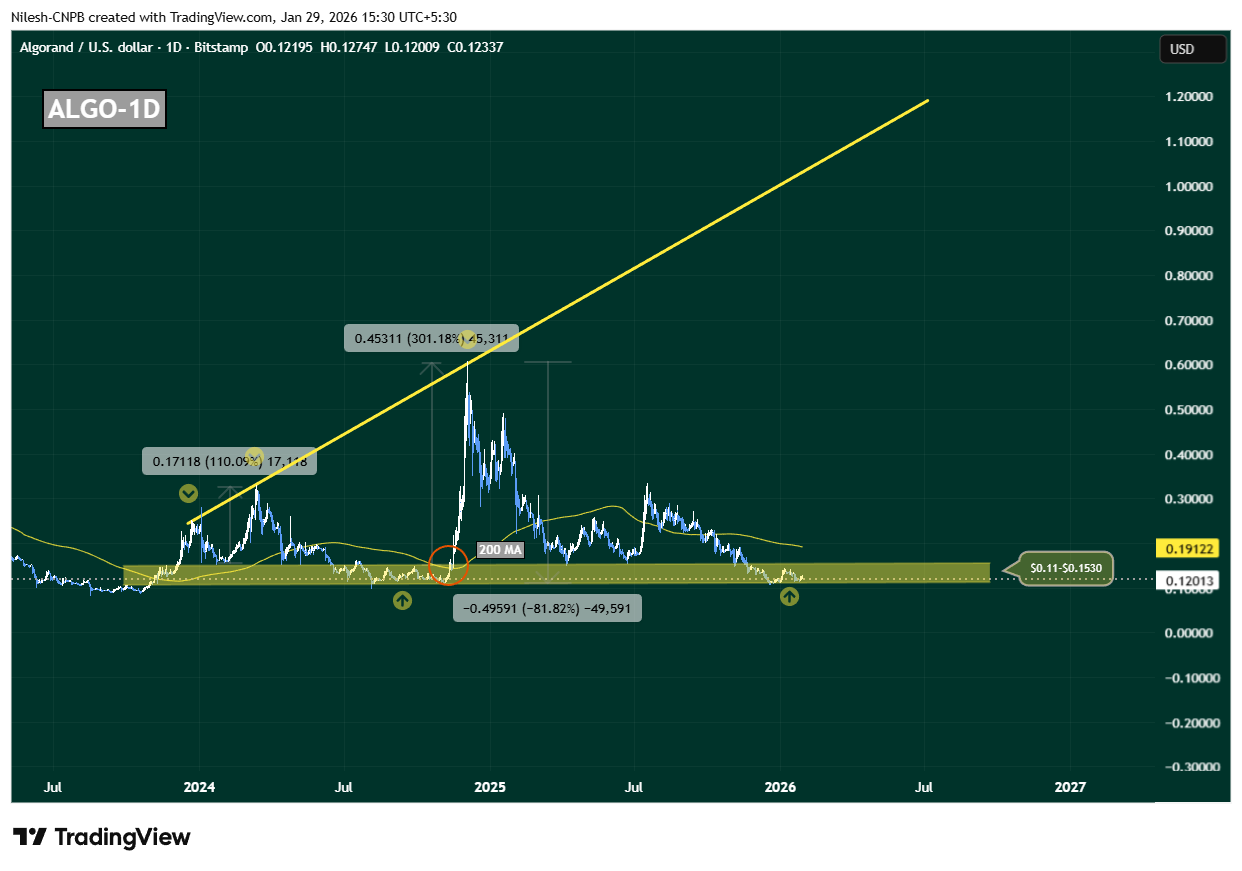
Algorand (ALGO) Daily Chart/Coinsprobe (Source: Tradingview)
This zone is not just technically important; it has also served as a launchpad during previous cycles, where downside momentum stalled and long-term buyers quietly stepped in.
History Rhymes on the ALGO Chart
What makes this setup particularly compelling is how closely it mirrors November 2024’s breakout structure. Back then, ALGO spent extended time consolidating near the same support band before reclaiming the 200-day moving average. Once that level flipped into support, price accelerated sharply—resulting in a 300% rally toward the ascending resistance trendline.
Today, ALGO is once again compressing inside this accumulation range, while the 200-day moving average sits overhead near $0.1912, acting as dynamic resistance. This alignment suggests the market may be approaching another inflection point.
What’s Next for ALGO?
At present, ALGO is hovering near $0.12, firmly inside its long-term accumulation zone. As long as price holds above this region, the broader bullish fractal remains intact.
A clean and sustained reclaim of the 200-day moving average around $0.1912 would be a critical confirmation signal. If bulls manage to flip this level into support, it would closely replicate previous breakout conditions and could trigger a sharp upside expansion. In that scenario, $0.60 becomes a realistic medium-term target, with further upside possible toward the ascending resistance trendline if momentum builds.
However, the structure is not without risk. A decisive breakdown below $0.11 would weaken the accumulation thesis, signal loss of long-term support, and open the door for deeper downside.
For now, ALGO sits at a make-or-break zone. The chart suggests patience is key—but if history repeats, this quiet phase may not last much longer.
Disclaimer: The views and analysis presented in this article are for informational purposes only and reflect the author’s perspective, not financial advice. Technical patterns and indicators discussed are subject to market volatility and may or may not yield the anticipated results. Investors are advised to exercise caution, conduct independent research, and make decisions aligned with their individual risk tolerance.
About Author: Nilesh Hembade is the Founder and Lead Author of Coinsprobe, with over 5 years of experience in the cryptocurrency and blockchain industry. Since launching Coinsprobe in 2023, he has been providing daily, research-driven insights through in-depth market analysis, on-chain data, and technical research.
Disclaimer: The information on this page may come from third parties and does not represent the views or opinions of Gate. The content displayed on this page is for reference only and does not constitute any financial, investment, or legal advice. Gate does not guarantee the accuracy or completeness of the information and shall not be liable for any losses arising from the use of this information. Virtual asset investments carry high risks and are subject to significant price volatility. You may lose all of your invested principal. Please fully understand the relevant risks and make prudent decisions based on your own financial situation and risk tolerance. For details, please refer to
Disclaimer.
Related Articles
'Black Swan' Author Nassim Taleb Believes Elon Musk's X Money is 'Much Smarter' Than Bitcoin - U.Today
Elon Musk's X Money will enter early access in April, with Nassim Taleb praising it as a superior alternative to Bitcoin. He argues it promotes competition in currency issuance, functional daily use, and is backed by a robust infrastructure, unlike volatile cryptocurrencies.
UToday28m ago
ETH 15-minute decline of 0.80%: On-chain large fund flows and DEX selling pressure resonate to trigger a downtrend
2026-03-11 15:00 to 2026-03-11 15:15 (UTC), ETH price briefly and rapidly declined within the range of 2042.35 to 2065.57 USDT, with a K-line return of -0.80% and an amplitude of 1.13%. Market volatility intensified during this period, with significantly increased attention, and short-term market pressure triggered market alertness.
The main driving force behind this anomaly is large-scale on-chain fund flows and sell pressure concentrated on decentralized exchanges (DEX). Monitoring data shows multiple large ETH transfers to trading platforms, suspected to involve institutions or whales.
GateNews48m ago
XRP Price Hints at Bullish Reversal as Negative Funding Rates Build Pressure on Short Sellers
XRP shows potential for a bullish reversal as market indicators align, with negative funding rates possibly triggering a short squeeze. Technical patterns and whale accumulation further support an upward move, indicating a significant price change may be imminent.
CryptometerIo1h ago
Shiba Inu (SHIB) regains momentum as buying pressure reaches the highest level of the month
The price of Shiba Inu (SHIB) is fluctuating around the 0.0000056 USD mark at the time of writing on Wednesday, after rising nearly 7% over the past two days. This recovery trend appears as on-chain indicators and derivatives market data begin to send positive signals. Trading volume is increasing.
TapChiBitcoin1h ago
Goldman Sachs: Hedge fund positioning may create conditions for a rebound in US stocks, with short positions rising to the highest since September 2022
Goldman Sachs report indicates that the structure of hedge fund positions in the US stock market is creating conditions for a market rebound. Speculators maintain long positions while shorting ETFs and futures. Short positions have reached their highest level since September 2022, reflecting market responses to uncertainty. If positive news emerges, it could trigger a rapid market rally.
GateNews2h ago
ETH 15-minute increase of 0.83%: Whales' capital inflow and DeFi lending demand resonate to drive the price
Between 13:30 and 13:45 (UTC) on March 11, 2026, ETH experienced a short-term fluctuation. The candlestick data shows a return of +0.83%, with a price range of 2046.07 to 2082.31 USDT, and an amplitude of 1.77%. Market activity increased during this period, with trading volume significantly higher than the previous cycle, and volatility exceeding the intraday average, attracting widespread market attention.
The main drivers of this fluctuation were the rapid inflow of large on-chain funds and active institutional accounts. Between 13:32 and 13:43,
GateNews2h ago