The Silver (XAG) price just broke a structure that had capped price for hundreds of years. That is the claim behind a chart now circulating among long-term commodity traders.
That view comes from Graddhy, an analyst followed by more than 100,000 traders who focuses on long-term price structure and historical cycles.
His claim is simple but extreme. Silver has completed the largest breakout in its recorded history.
- What The Silver Chart Is Showing
- Why $800 Is Not Random For Silver Price
- Here’s Why The Bull Market Has Not Ended
What The Silver Chart Is Showing
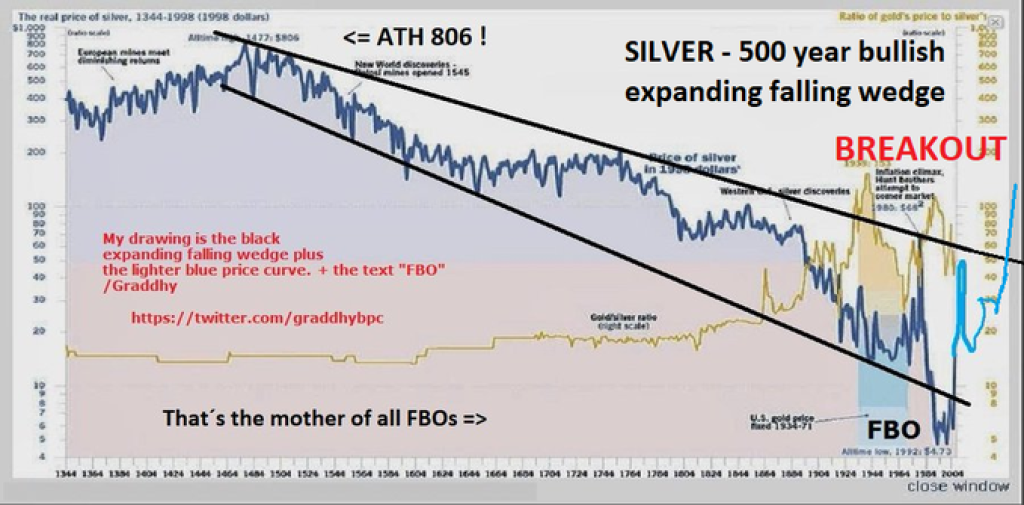
Graddhy’s chart tracks silver prices going back more than 500 years. Over that entire period, silver moved inside a massive expanding falling wedge. Every major rally failed. Every breakout attempt rolled over. The metal stayed locked in decline for centuries.
That changed around the turn of the millennium. The Silver price began forming a long base that lasted close to two decades. This base acted as a false breakout phase, not a top. Price needed years just to absorb selling pressure built over generations.
Silver did not escape the structure easily. It had to trade above $60 just to clear the upper boundary of that wedge. Only after that level broke did the larger pattern complete.
Source: X/Graddhy’s
Why $800 Is Not Random For Silver Price
Many still anchor silver’s all-time high to $50. That number is misleading. In real terms, silver peaked near $806 in 1998 dollar value. Adjusted for inflation, that level sits much higher today.
From Graddhy’s perspective, the recent breakout opens the door for a return to those extremes during the later stages of the bull market. Not as a steady climb, but as a sharp, emotional move that tends to appear near cycle peaks.
This type of behavior has shown up before in commodities once long-term ceilings give way.
_****Why Is World Liberty Financial (WLFI) Price Up?**
Furthermore, the long sideways period after 2000 served a purpose. It drained momentum and removed weak positioning. That phase forms the cup portion of a much larger cup-and-handle structure that spans more than four decades.
Once price moved beyond the handle and cleared the wedge, the technical condition changed completely. What came before no longer defines what comes next. That is why this move carries weight beyond a normal bull run.
Here’s Why The Bull Market Has Not Ended
From this perspective, the recent volatility does not mark a top. It marks the early phase of a new regime. Long-term structures do not complete quietly. They reset how price behaves for years.
The Silver price spent centuries capped by the same forces. Those caps are now gone.
Whether $800 appears briefly or not, the message of the chart is clear. The precious metals bull market did not end. It started.
Disclaimer: The information on this page may come from third parties and does not represent the views or opinions of Gate. The content displayed on this page is for reference only and does not constitute any financial, investment, or legal advice. Gate does not guarantee the accuracy or completeness of the information and shall not be liable for any losses arising from the use of this information. Virtual asset investments carry high risks and are subject to significant price volatility. You may lose all of your invested principal. Please fully understand the relevant risks and make prudent decisions based on your own financial situation and risk tolerance. For details, please refer to
Disclaimer.
Related Articles
Aave Price Holds Near $111 After $27M Liquidation Error Shakes DeFi
Key Insights
Aave traded near $111 after a CAPO oracle configuration error triggered $27 million in liquidations across 34 wstETH-backed accounts.
Trading activity cooled as derivatives volume dropped and open interest declined, signaling that traders stepped back following the liquidation in
CryptoFrontNews30m ago
XRP Holds $1.34 Support While Leverage Heatmap Highlights $1.30 Risk Zone
XRP is trading at $1.36 in a tight range of support at $1.34 and resistance at $1.37.
The heatmap data indicates that there is a huge amount of long positions in the range of $1.30.
Should prices fall to around $1.30, long positions with high leverage in this region might
CryptoNewsLand56m ago
Crypto Market Update – River and Hyperliquid Lead Gainers As Decentralized Infrastructure Gains M...
The crypto market is displaying its typical volatility once again, yet under the noise of price movements, the beginnings of a narrative are starting to take shape. As of today, the “Top Gainers” on CoinMarketCap leans heavily towards projects targeting decentralized infrastructure and fast Layer-1s
BlockChainReporter1h ago
Solana Approaches Key Sell Wall at $84.78 — Will Momentum Hold for a Move Toward $89?
Solana is trading at an approximate price of $83.18, although a solid sell wall is at an approximate price of $84.78, which prevents upward movement.
The price is trapped between the support at $81.99 and the resistance at $84.78 which is short term consolidation.
Once buyers hit the
CryptoNewsLand2h ago
SOL Consolidates Near $84 While Chart Highlights Possible $45 Demand Zone
Solana (SOL) trades at $83.87 within a range defined by $81.03 support and $84.43 resistance, showing consolidation below a $90 supply zone. There is a broader demand area near $45, indicating potential downward movement before recovery.
CryptoNewsLand2h ago