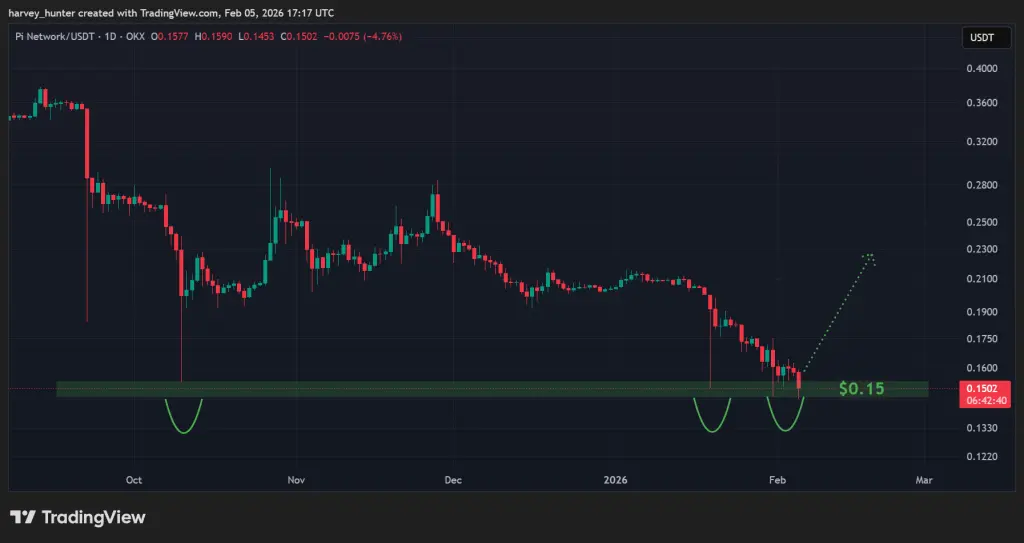
Pi Network holds the critical support at $0.15. The November breakout of the descending wedge remains valid. RSI breaking below 30 indicates oversold conditions, and MACD approaching a golden cross. If support holds, the target of $0.20 could rise by 33%, with higher potential up to $0.65, representing a 330% increase.
$0.15 Critical Support Level Determines Pi Network’s Direction
(Source: Trading View)
Pi Network Currently, the key long-term support at $0.15 is holding, which may determine whether the token stabilizes or continues to decline. This level has become the last line of defense for bullish Pi price forecasts. If it fails, the downward trend below this level could become very dangerous, as historical trading activity below this price is minimal, indicating a lack of structural support to absorb significant selling pressure.
From a technical analysis perspective, the effectiveness of support depends on trading volume historically accumulated at this level. Around $0.15, Pi Network was an important trading zone in early 2025, with substantial chips changing hands. These historical transactions formed a “cost concentration zone,” where holders who bought at this level tend to add to their positions or hold firmly, providing buying support.
However, if $0.15 fails, the area below is almost a vacuum. Between $0.15 and $0.10, Pi Network’s historical trading volume is extremely sparse, indicating a lack of obvious support levels. Under this market structure, a break below $0.15 could lead to accelerated decline until reaching the next meaningful support, possibly at $0.10 or even lower.
Conversely, if bulls step in now, this area could serve as a strong rebound base. The current trend of Pi Network may determine whether the price continues downward or shows a meaningful reversal. From a risk-reward perspective, around $0.15 is a critical level to watch, as downside is limited but upside potential is significant.
Testing support usually takes time to confirm. Price doesn’t bounce immediately upon touching support but oscillates around this level for several days, accumulating enough volume and buy orders. Pi Network is currently in this oscillation testing phase; the upcoming days’ price action will decide if $0.15 can be defended.
Breakout of the Descending Wedge Still Valid, Technicals Turn Bullish
Pi Network may be approaching the demand zone needed to balance the increasing supply, as technical indicators are beginning to outline a credible bullish outlook. The November breakout of the descending wedge pattern remains technically valid; recent declines may simply be a full retest of the existing pattern rather than a structural failure.
A descending wedge is a classic bullish reversal pattern, formed by two converging downward trendlines. When the price breaks above the upper trendline, it typically signals the end of the downtrend and the start of an uptrend. Pi Network completed this breakout in November, with a significant price surge. However, subsequent retracement brought the price back near the wedge’s upper boundary, which is a normal technical phenomenon.
In technical analysis, a retest after a breakout is a critical stage to validate the breakout’s effectiveness. If the price can hold above the previous resistance (now support) during the retest, the breakout is confirmed, and upward potential opens. Conversely, if the price falls back below the wedge’s upper boundary during the retest, the breakout fails, and the price may return inside the wedge or even break down below the lower boundary.
Momentum indicators increasingly suggest that sellers may be exhausted. RSI breaking below the oversold threshold of 30 indicates signs of capitulation, increasing the likelihood that this area remains as important as the initial entry point. RSI below 30 generally signals an asset is oversold, undervalued, and may trigger a short-term rebound.
The MACD also shows similar signs. It is approaching a bullish crossover above the signal line, which often marks a trend reversal to the upside. A golden cross occurs when the fast line crosses above the slow line, indicating short-term momentum surpassing long-term momentum. Pi Network’s MACD is on the verge of this crossover; confirmation in the coming days would provide a strong buy signal.
Technical Bullish Signals for Pi Network
· Breakout of descending wedge is being retested, pattern remains valid
· RSI broke below 30 into oversold, capitulation signs evident
· MACD approaching golden cross, momentum shifting
· $0.15 historical support provides buying defense
· Limited downside, clear upside targets
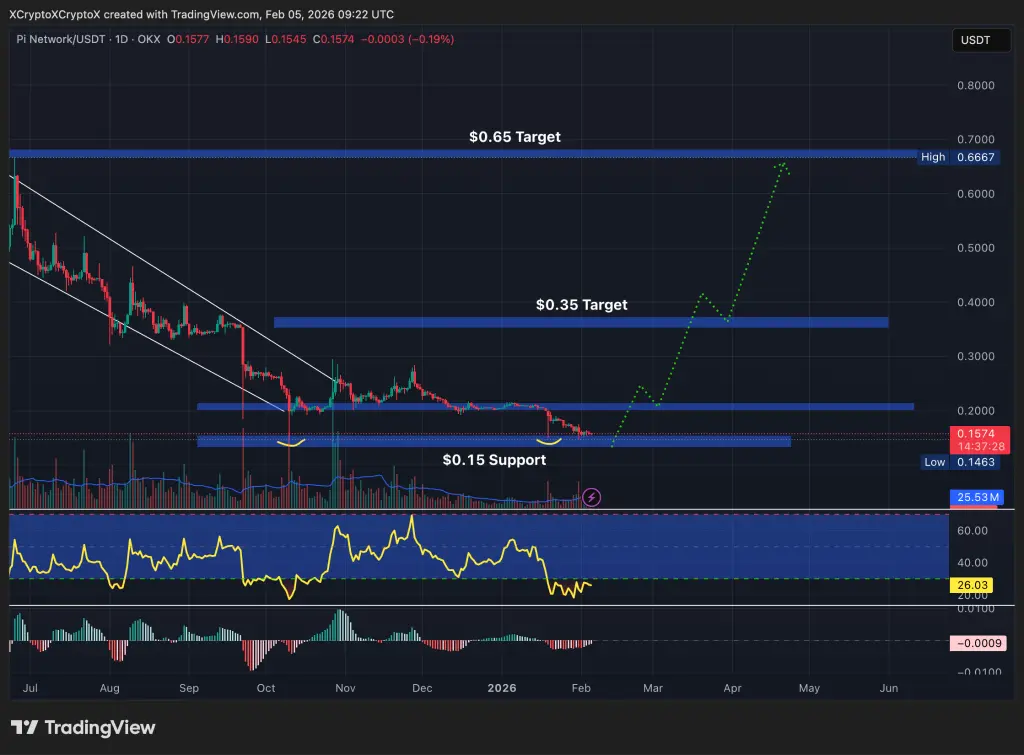
Target at $0.20 Up 135%, Higher Potential to $0.65
(Source: Trading View)
If this bullish scenario plays out, the $0.20 resistance will be the first major test. If it turns into support, it indicates demand has finally become strong enough to sustain further gains. Moving from about $0.15 to $0.20 represents roughly a 33% upside, a reasonable short-term target.
The $0.20 level is not arbitrarily chosen. It has been tested multiple times as resistance in the past and is a psychological round number. Breaking above $0.20 would break long-term resistance, attracting more buyers. Additionally, $0.20 is close to the 50-day moving average, an important indicator for medium-term trend assessment.
Once stabilized above $0.20, Pi Network’s price forecast could extend higher. A 135% increase could bring Pi back to the $0.35 level seen before the 2025 bear market. This target is based on Fibonacci retracement and previous highs, representing a partial recovery of recent declines.
An even more aggressive target is around $0.65, with a potential upside of 330% from current levels. This target is based on the full projection of the descending wedge pattern, which typically yields a rally at least equal to the height of the wedge after breakout. $0.65 is also a price level Pi Network reached during its mainnet launch, holding historical significance.
However, achieving these targets requires multiple conditions to be met simultaneously. First, support at $0.15 must hold; any effective breakdown invalidates the bullish case. Second, volume must confirm the breakout, especially at $0.20. Third, bullish signals from RSI and MACD need to be validated by price action, as technical indicators often lead but may not be immediately followed by price.
Disclaimer: The information on this page may come from third parties and does not represent the views or opinions of Gate. The content displayed on this page is for reference only and does not constitute any financial, investment, or legal advice. Gate does not guarantee the accuracy or completeness of the information and shall not be liable for any losses arising from the use of this information. Virtual asset investments carry high risks and are subject to significant price volatility. You may lose all of your invested principal. Please fully understand the relevant risks and make prudent decisions based on your own financial situation and risk tolerance. For details, please refer to
Disclaimer.