In brief
- Bitcoin bounced to above $69K after testing $60K lows, up 3.69% in 24 hours, but the daily chart shows strong bearish momentum.
- On Myriad, traders are pricing in 55% odds that Bitcoin touches $55K before recovering, reflecting persistent bearish sentiment.
- The Crypto Fear and Greed Index sits at 8—nearly an all-time low and in “extreme fear” territory.
The crypto market is still in full panic mode. The Crypto Fear and Greed Index sits at 8 points—extreme fear territory—just barely above the all-time low of 5 hit on February 6.
But even in a sea of red, there’s some hopium for degens to breathe. The global crypto market cap ticked up 4.3% today to $2.36 trillion, but that’s a modest bounce considering that around $2 trillion have been wiped out in recent weeks.
On Myriad, a prediction market developed by Decrypt’s parent company Dastan, traders are pricing in 55% odds that Bitcoin touches $55,000 before recovering to $84,000. That’s not exactly a vote of confidence. Meanwhile, British multinational bank Standard Chartered slashed its Bitcoin target from $300,000 to the $100K zone, warning the coin could crash to $50K first. Bitcoin ETF outflows also shed $410 million yesterday, as traders show even the most bullish can panic when red candlesticks populate their charts.
Today’s CPI data release could decide whether this bounce extends or collapses. Analysts expect inflation at 2.5% year-over-year. A hot print sends Bitcoin toward $60K. A cool one might give bulls breathing room.
Bitcoin (BTC) price: The bounce looks weak
Bitcoin rallied from $68,248 to an intraday high of $69,450 before settling around $69,321—up 3.69% in 24 hours. Not bad on the surface. But the bigger picture suggests you may want to keep your champagne on ice for a bit longer.
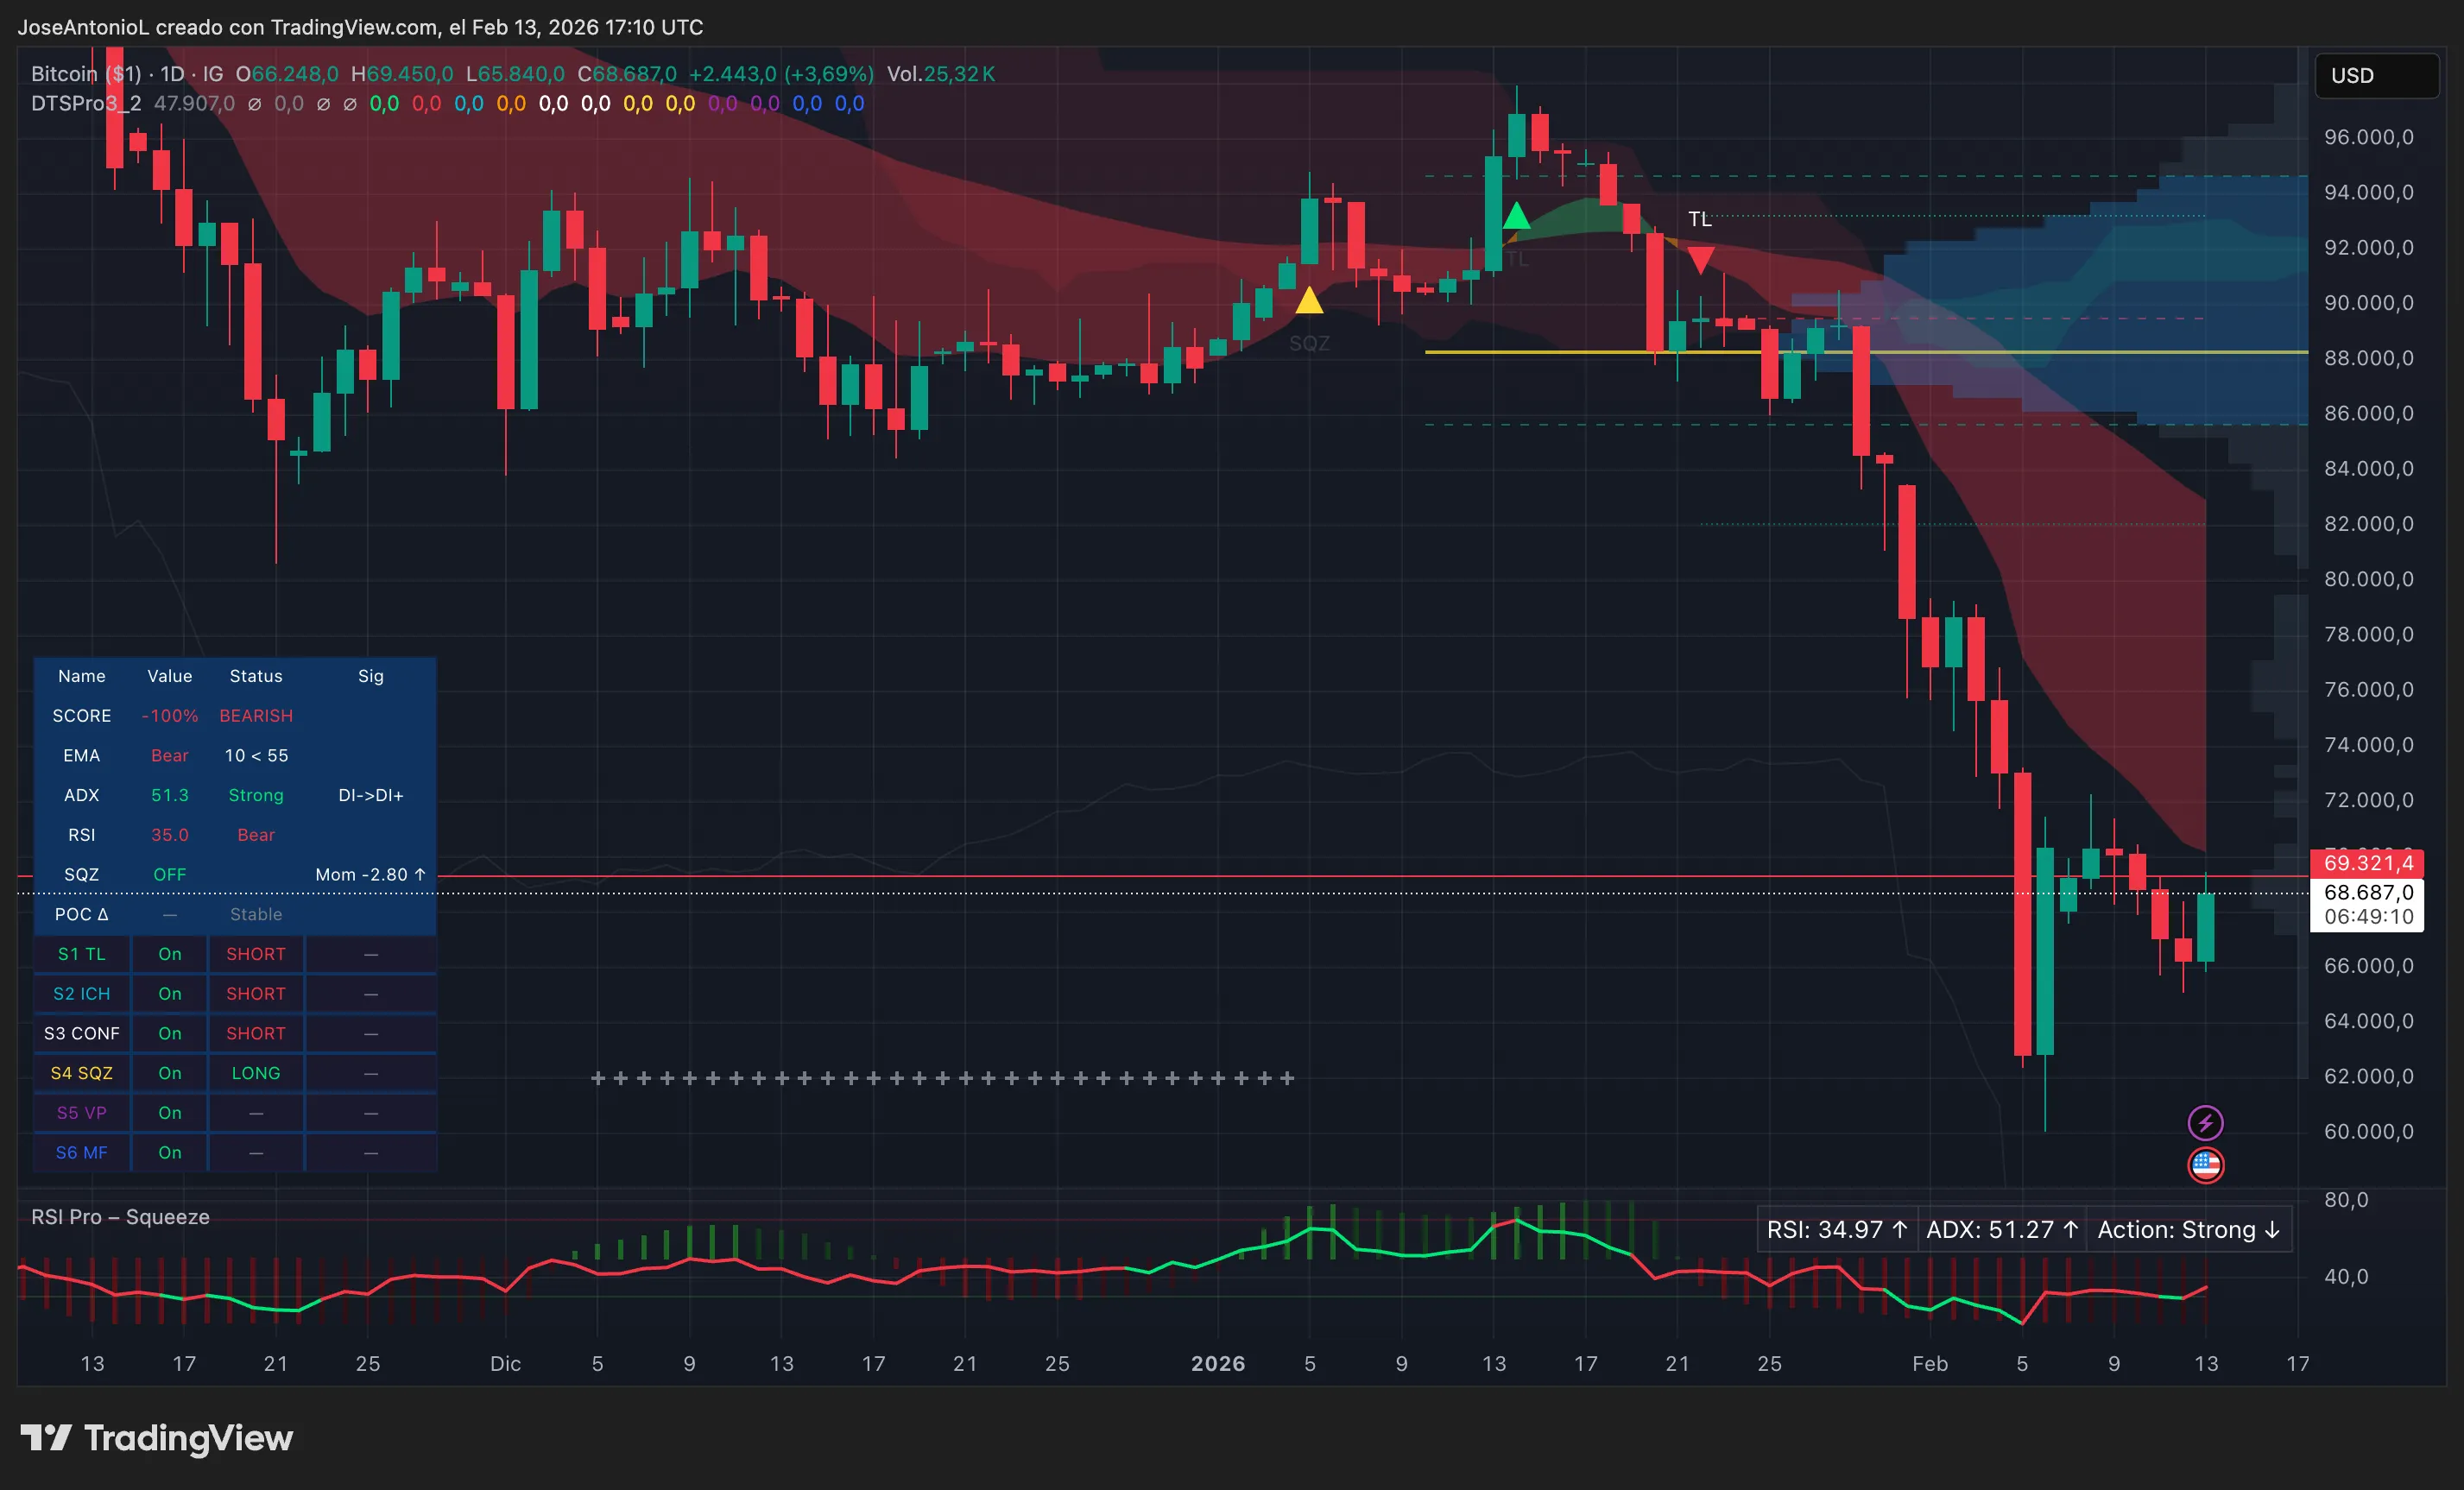
Bitcoin (BTC) price data. Image: Tradingview
The Average Directional Index, or ADX, sits at 51.3, signaling a strong bearish trend. ADX measures trend strength regardless of direction—readings above 25 confirm a trending market, and above 50 means conviction.
This recent bounce may lower the ADX numbers a bit, but it doesn’t mean Bitcoin has magically turned bullish. It just means you cannot be permabear, and it’s reasonable to expect “FUD” or “FOMO” episodes inside of solid trends.
The Relative Strength Index, or RSI, is at 35.0, firmly in bearish territory. RSI measures momentum from 0 to 100, with below 30 suggesting oversold conditions and above 70 overbought. At 35, Bitcoin has bounced off the $60K lows but remains far from neutral (50). Traders typically wait for RSI to break above 50 before calling a momentum shift. We’re not there yet.
The 50-day Exponential Moving Average, or EMA, trades well below the 200-day EMA—a classic bearish setup. EMAs help identify trend direction using weighted price averages. When the short-term EMA sits below the long-term one, recent price action is weaker than the broader trend. That creates a bearish structure.
Overall, Bitcoin bulls need another February 6-style candlestick—but bigger. A good second option could be a series of green daily closes pushing above $80,000, which would signal bulls are back. Until then, this is more likely noise inside a downtrend.
The 4-hour chart offers slightly better conditions for day traders and quick leverage plays.
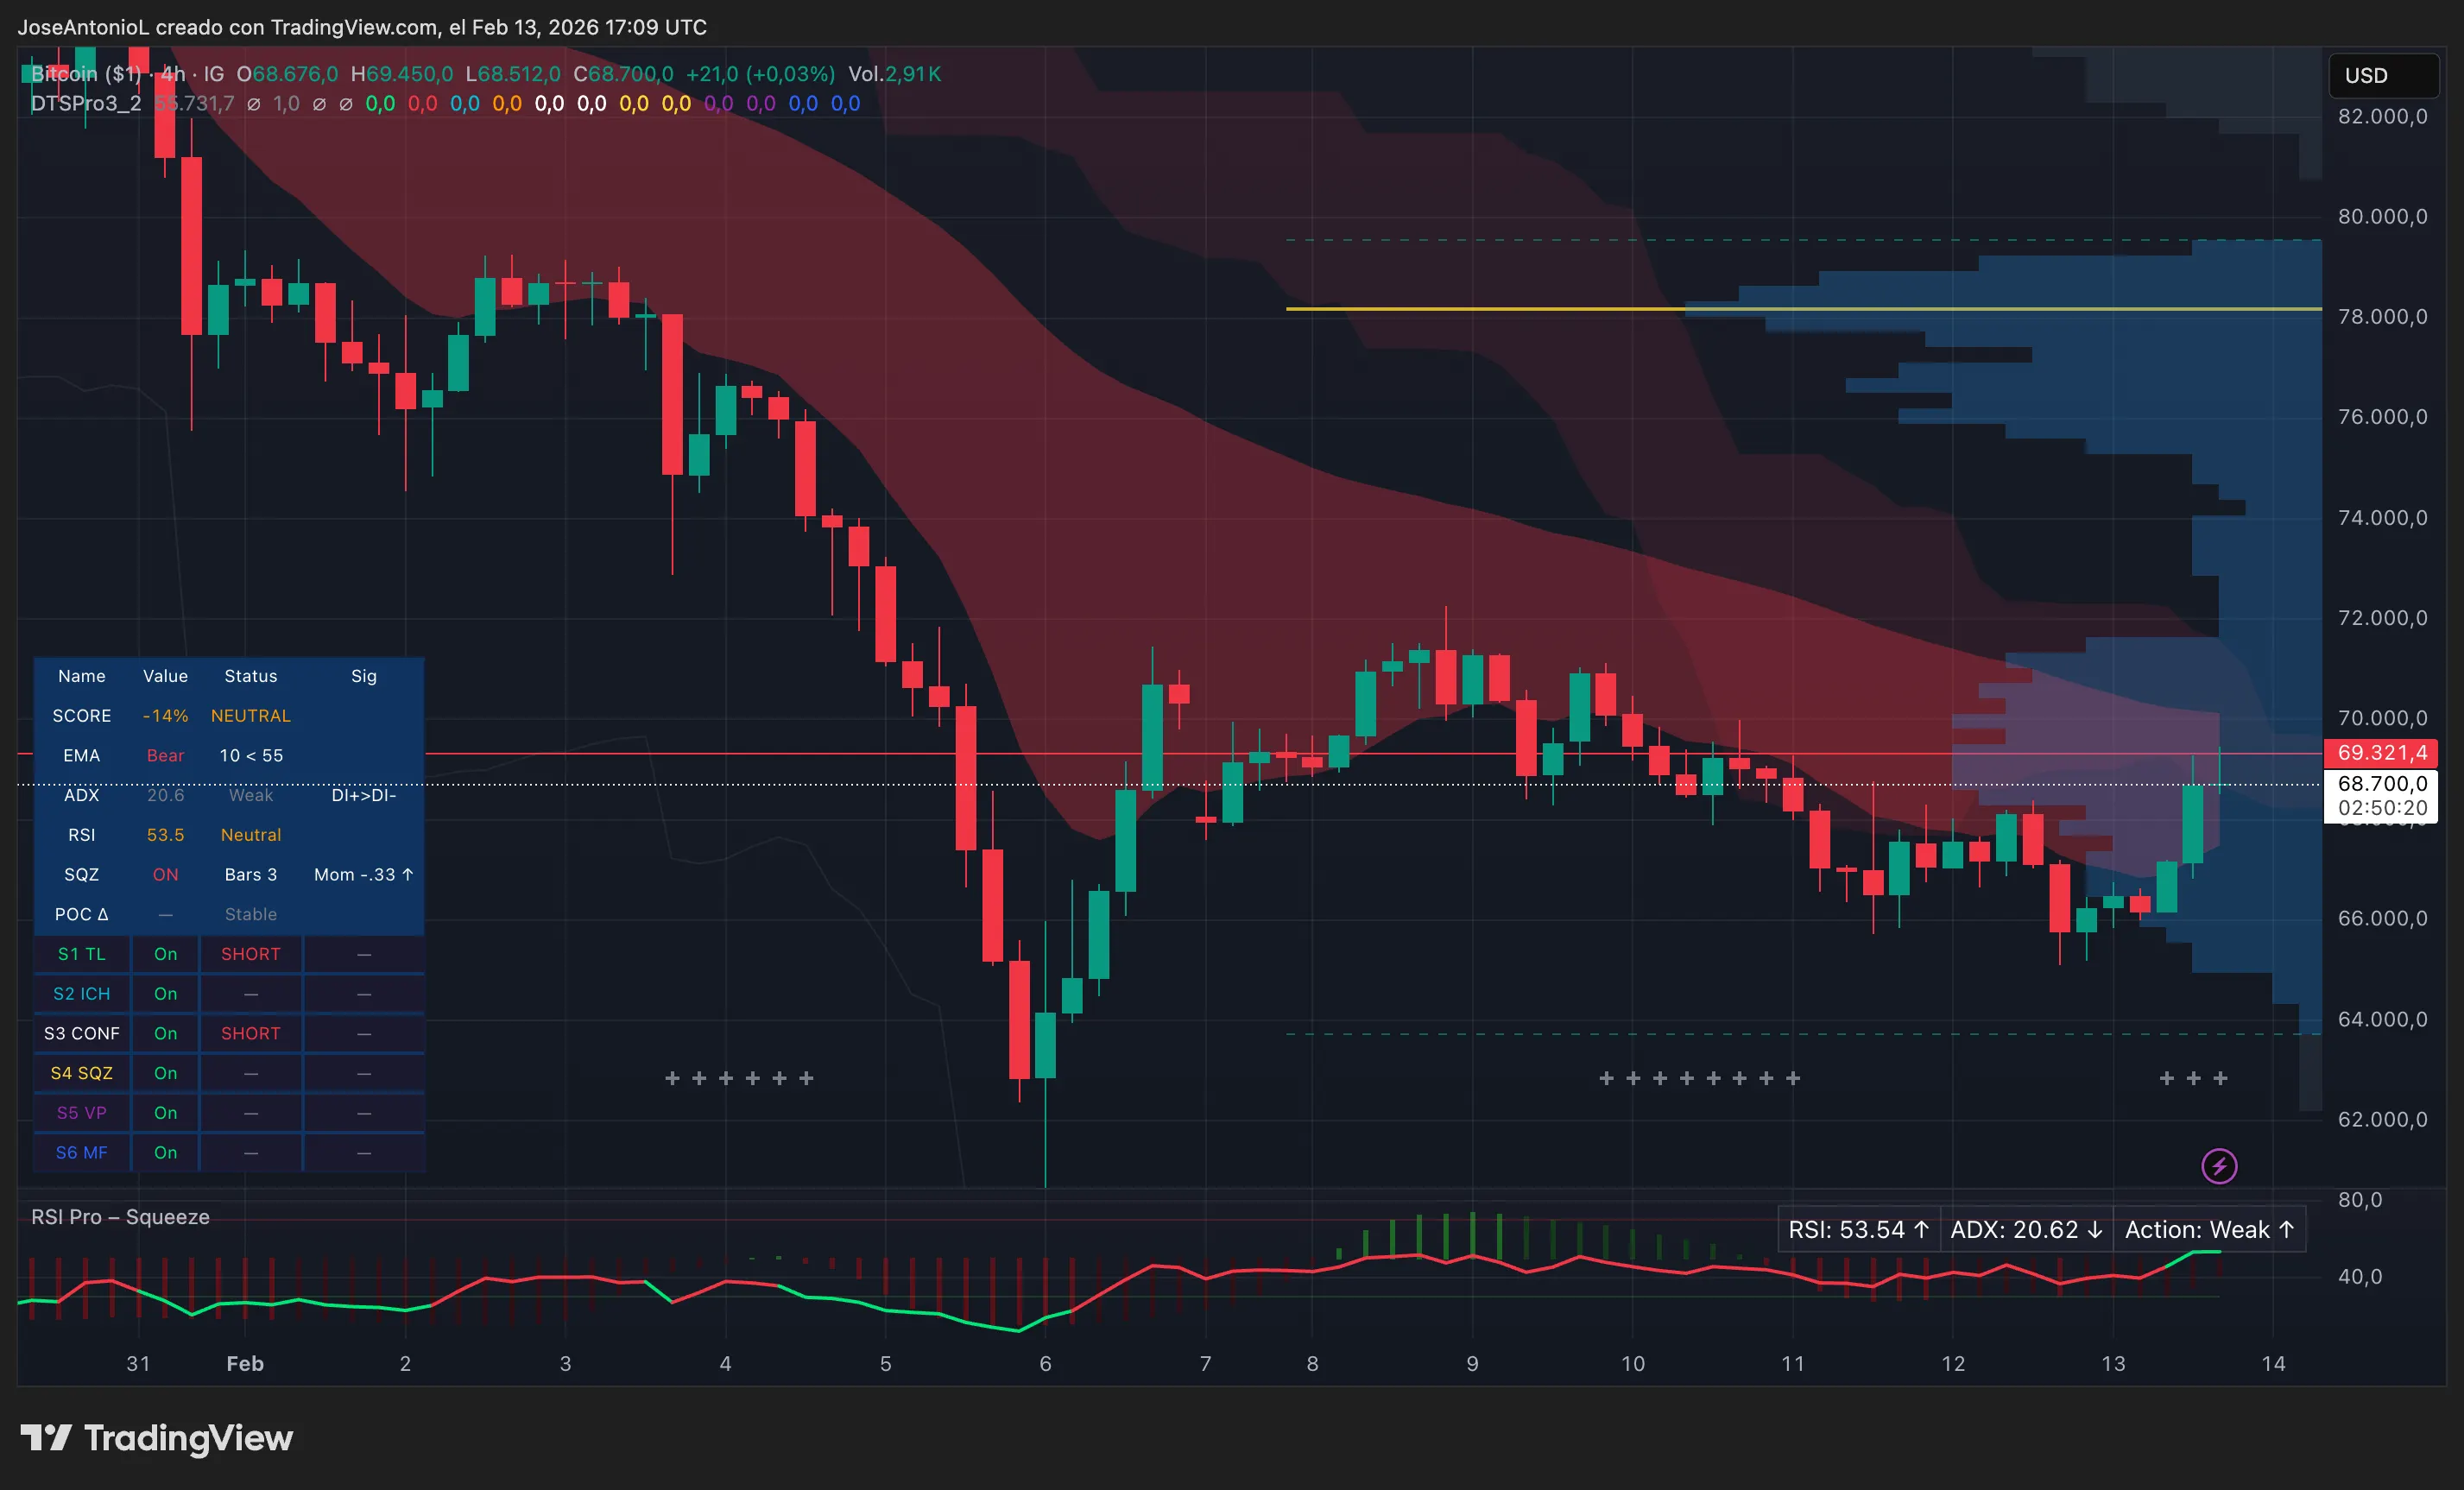
Bitcoin (BTC) price data. Image: Tradingview
The 4-hour ADX sits at 20.6 (weak, no clear trend) which is good for traders placing positions as Bitcoin bounces around between established supports and resistances. RSI at 53.6 is also neutral, and the Squeeze Momentum Indicator is “on,” suggesting compression before a move. But with the daily trend bearish, any 4-hour rally likely hits resistance hard. If you’re swing trading or holding, the daily trend is your boss.
This bounce isn’t enough to signal a trend reversal. The daily chart shows strong bearish momentum (ADX 51.3), weak RSI (35.0), and bearish EMAs. The 4-hour chart might let day traders scalp a move to $70K-$72K, but swing traders and holders would likely be wise to remain cautious.
Disclaimer: The information on this page may come from third parties and does not represent the views or opinions of Gate. The content displayed on this page is for reference only and does not constitute any financial, investment, or legal advice. Gate does not guarantee the accuracy or completeness of the information and shall not be liable for any losses arising from the use of this information. Virtual asset investments carry high risks and are subject to significant price volatility. You may lose all of your invested principal. Please fully understand the relevant risks and make prudent decisions based on your own financial situation and risk tolerance. For details, please refer to
Disclaimer.
Related Articles
DWF Labs:传统山寨季走向终结,机构资金转向BTC、ETH与RWA
DWF Labs的Andrei Grachev指出,传统"山寨季"因加密市场结构变迁正逐渐消失,机构资金更青睐比特币和以太坊,导致山寨币面临更高风险和资金流出。过去13个月,山寨币市值降逾2090亿美元。
GateNews2m ago
Bitcoin rose 8.55% this week, potentially marking the largest single-week gain since September 2025
Gate News reported on March 15 that according to Coinglass data, Bitcoin's weekly return rate is currently at 8.55%, with a historical average return rate of -1.03%. Despite the escalating Iran-Israel conflict and prevailing risk-averse sentiment in the market, Bitcoin is poised to record its largest single-week gain since September 2025. During the same period, the S&P 500 index (the benchmark index for the U.S. stock market) declined by 1.60%, with BTC's performance significantly outperforming the U.S. stock market.
GateNews10m ago
Bitcoin Cash Holds Support at $440 but Sellers Remain in Control
Bitcoin Cash (BCH) has corrected to a long-term support zone in the range of $440-$470, which is an area located just below the midpoint of the trading range that BCH has maintained over the past two years. Retesting this long-term support zone could open up an opportunity for a trend reversal in a positive direction.
TapChiBitcoin20m ago
BTC breaks through $73,000, short liquidation intensity will reach $429 million; falls below $70,000, long liquidation intensity reaches $459 million
According to Coinglass data, if Bitcoin price breaks through $73,000, centralized exchanges will face $429 million in short liquidation pressure, while if it falls below $70,000, $459 million in long positions will be liquidated. This reflects the degree of impact price volatility has on the market.
GateNews46m ago
Bitcoin Nears $74K as Data Signals Bear Market Isn’t Over
Bitcoin extended gains above $73,000 on Friday, stabilizing near a long-standing floor around $70,000 as macro data and geopolitical tensions shape risk appetite. The move followed a US GDP release showing the economy grew just 0.7% in the fourth quarter of 2025, keeping recession fears on the
CryptoBreaking1h ago