
Bitcoin is trading around $68K right now, but a CryptoQuant chart making the rounds is putting a much lower number back on the table: $39K. The logic comes from one of the most watched on-chain “line in the sand” metrics in crypto cycles — realized price.
- What the BTC chart is showing
- What “realized price” means in plain English
- How realistic is $55K… and the $39K flush?
- The levels that matter from here
What the BTC chart is showing
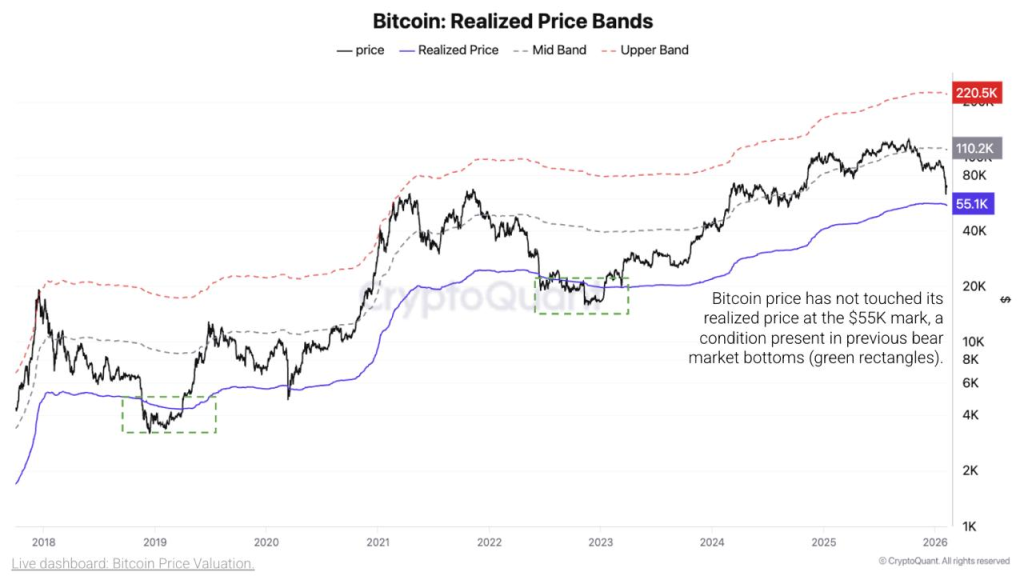
The chart plots Bitcoin’s market price (black) against realized price (blue), plus a set of bands above it. On the right side, the realized price level sits near $55.1K.
The key observation: in prior bear market bottoms, Bitcoin didn’t bottom until price came down to realized price (the green-highlighted zones on older cycles). In the current cycle, price has not tagged that realized-price line yet.
Those dashed bands matter for context, too. They act like valuation zones across cycles:
- The realized price acts like a “cost basis anchor” for the market.
- The higher bands map out hotter valuation zones that usually show up in full-risk-on phases.
Source: X/@coinbureau
What “realized price” means in plain English
Realized price is basically Bitcoin’s average** on-chain cost basis**: it values each coin at the last price it moved on-chain, then averages that across the supply. Put simply, it estimates what the market, as a whole, paid for its BTC.
Why traders care: when Bitcoin trades above realized price, the average holder is in profit. When it trades at or below realized price, the market is under stress and capitulation dynamics show up more often.
It’s not a magic bottom button, but it’s one of the cleaner “where does pain peak” gauges that tends to matter most during deep drawdowns.
How realistic is $55K… and the $39K flush?
From $68K to $55K is a drop of about 19%. That’s completely plausible in crypto terms, especially during a volatility spike or a broader risk-off move.
The more extreme number comes from the historical note baked into the post: in past cycles, Bitcoin pushed 24–30% below it before the final low printed.
If realized price is ~$55K:
- 24% below is about $41.8K
- 30% below is about $38.5K
That’s where the $39K headline comes from. It’s basically a “full capitulation” scenario where the market overshoots the average cost basis before stabilizing.
The reality check: a drop to $39K would require a much more aggressive unwind than a normal pullback. It would likely need a sharp liquidity event, a macro shock, or a broad deleveraging wave that forces sellers to dump into a thin bid.
Read also: AI is Coming For Your Stocks – Here’s What You Need to Know
The levels that matter from here
If this realized-price framework is the lens, then the map is straightforward:
- $68K (current area): market still holding above the “pain line,” but not far enough to dismiss a deeper reset.
- $60K: a psychological and structural zone that tends to get defended first.
- $55K (realized price): the key level CryptoQuant is flagging as the classic bear-market bottom condition.
- $42K–$39K: the “overshoot” zone if panic selling drives a final flush below realized price.
If Bitcoin holds above the low $60Ks and keeps bouncing, the realized-price tag may never happen this cycle. If momentum breaks and $60K fails decisively, realized price becomes the next major magnet.
Bottom line: $55K is the realistic stress-test level. $39K is the capitulation tail-risk level that becomes relevant only if the market gets forced into a hard reset.
Read also: Bitcoin at $60K Could Be the Deal of the Decade
Disclaimer: The information on this page may come from third parties and does not represent the views or opinions of Gate. The content displayed on this page is for reference only and does not constitute any financial, investment, or legal advice. Gate does not guarantee the accuracy or completeness of the information and shall not be liable for any losses arising from the use of this information. Virtual asset investments carry high risks and are subject to significant price volatility. You may lose all of your invested principal. Please fully understand the relevant risks and make prudent decisions based on your own financial situation and risk tolerance. For details, please refer to
Disclaimer.
Related Articles
Bitcoin rebounds and breaks through $67,000, currently quoted at $67,175.11
Gate News Report, March 9th: Market data shows that Bitcoin rebounded and broke through $67,000, currently priced at $67,175.11.
GateNewsJust Now
BTC Breaks Through 67,000 USDT
Gate News bot message, Gate market display, BTC breaks through 67,000 USDT, current price 67,053 USDT.
CryptoRadar3m ago
Bitcoin’s Next Move Depends on Gold and Silver As Analysts Eye $60K Support or a Return to All-Ti...
According to Michaël van de Poppe’s March 8, 2026, chart-backed assessment, Bitcoin’s future price action will depend on the next few days’ performance of gold, silver, and oil. If there continues to be a cooling of precious metals and capital is rotated back into risk capital, he believes it will t
BlockChainReporter7m ago
Michael Saylor Hints at Another Bitcoin Purchase as Strategy's STRC Trading Volume Surges to $260M
Michael Saylor, Executive Chairman of Strategy, has signaled an impending Bitcoin acquisition with a March 8, 2026 social media post reading "The Second Century Begins" alongside the company's BTC accumulation chart, following an established pattern of weekend hints preceding formal purchase announcements.
CryptopulseElite15m ago
BTC 15-minute increase of 0.68%: Whales' capital inflow and geopolitical safe-haven funds resonate to drive a short-term rebound
2026-03-09 02:30 to 2026-03-09 02:45 (UTC), Bitcoin (BTC) achieved a +0.68% return within 15 minutes, with the price range between 66,095.6 and 66,585.0 USDT, and an amplitude of 0.74%. Amid geopolitical conflicts, market attention during this period significantly increased, volatility intensified compared to normal levels, and trading activity rapidly surged.
The main driver of this anomaly was the concentrated inflow of whale funds into a certain trading platform. On-chain data shows that recent whale transfers of BTC to exchanges have sharply increased.
GateNews24m ago
Bitcoin Bull Trap Forms as Bear Market Enters Mid-Phase, Willy Woo
Bitcoin outlook remains mixed as on-chain analyst Willy Woo warns of a potential bull trap ahead of a broader downtrend return. In a Saturday post on X, Woo cautioned that a short-lived breakout could lure investors into believing a sustainable rally is underway, potentially persisting into the end
CryptoBreaking46m ago