
MicroStrategy (MSTR) purchased 592 Bitcoin on February 23 at an average price of approximately $67,286, spending about $40 million, which increased its total Bitcoin holdings to 717,722 coins with an overall average cost of $76,020 per coin. However, this purchase did not support a continued rise in MSTR’s stock price. The Chaikin Money Flow (CMF) indicator is currently near zero, indicating that institutional investors have not yet followed with increased holdings.
Latest Buy Signal Fails to Boost Institutional Confidence
MicroStrategy has traditionally used continuous Bitcoin accumulation as a market signal of long-term conviction, which often boosts investor sentiment. However, after the February 23 purchase announcement, MSTR’s stock price continued to decline along the bear flag pattern that began on February 19, rather than showing the expected confidence rebound.
On February 24, MSTR’s stock price fell over 9%; on February 25, boosted by Bitcoin’s rebound from $64,500 to $69,400 (a 2.5% increase), MSTR briefly rose to $137, but quickly dropped as Bitcoin retreated. This movement again confirms MSTR’s high correlation with Bitcoin—when Bitcoin stalls or weakens, MSTR’s decline tends to be amplified.
CMF Approaching Zero: Key Shift in Institutional Capital Signals
The CMF combines price and volume to measure the actual buying and selling activity of large investors like institutions. A CMF above zero indicates institutional accumulation, while below zero indicates outflows.
From January 12 to February 23, MSTR’s stock price declined, but CMF rose countertrend, forming a bullish divergence—suggesting institutional investors quietly increased holdings during market weakness, ultimately driving about a 33% rebound from February 5 to 25.
However, after the February 23 Bitcoin purchase announcement, the CMF trend shifted markedly, now hovering near zero. This suggests that institutional investors are currently uncertain about MSTR’s direction and have not increased their holdings in response to the company’s continued Bitcoin accumulation. This structural divergence—“buying Bitcoin but not following with stock purchases”—weakens the bullish case.
Technical Analysis: Bear Flag Breakdown and Downside Targets
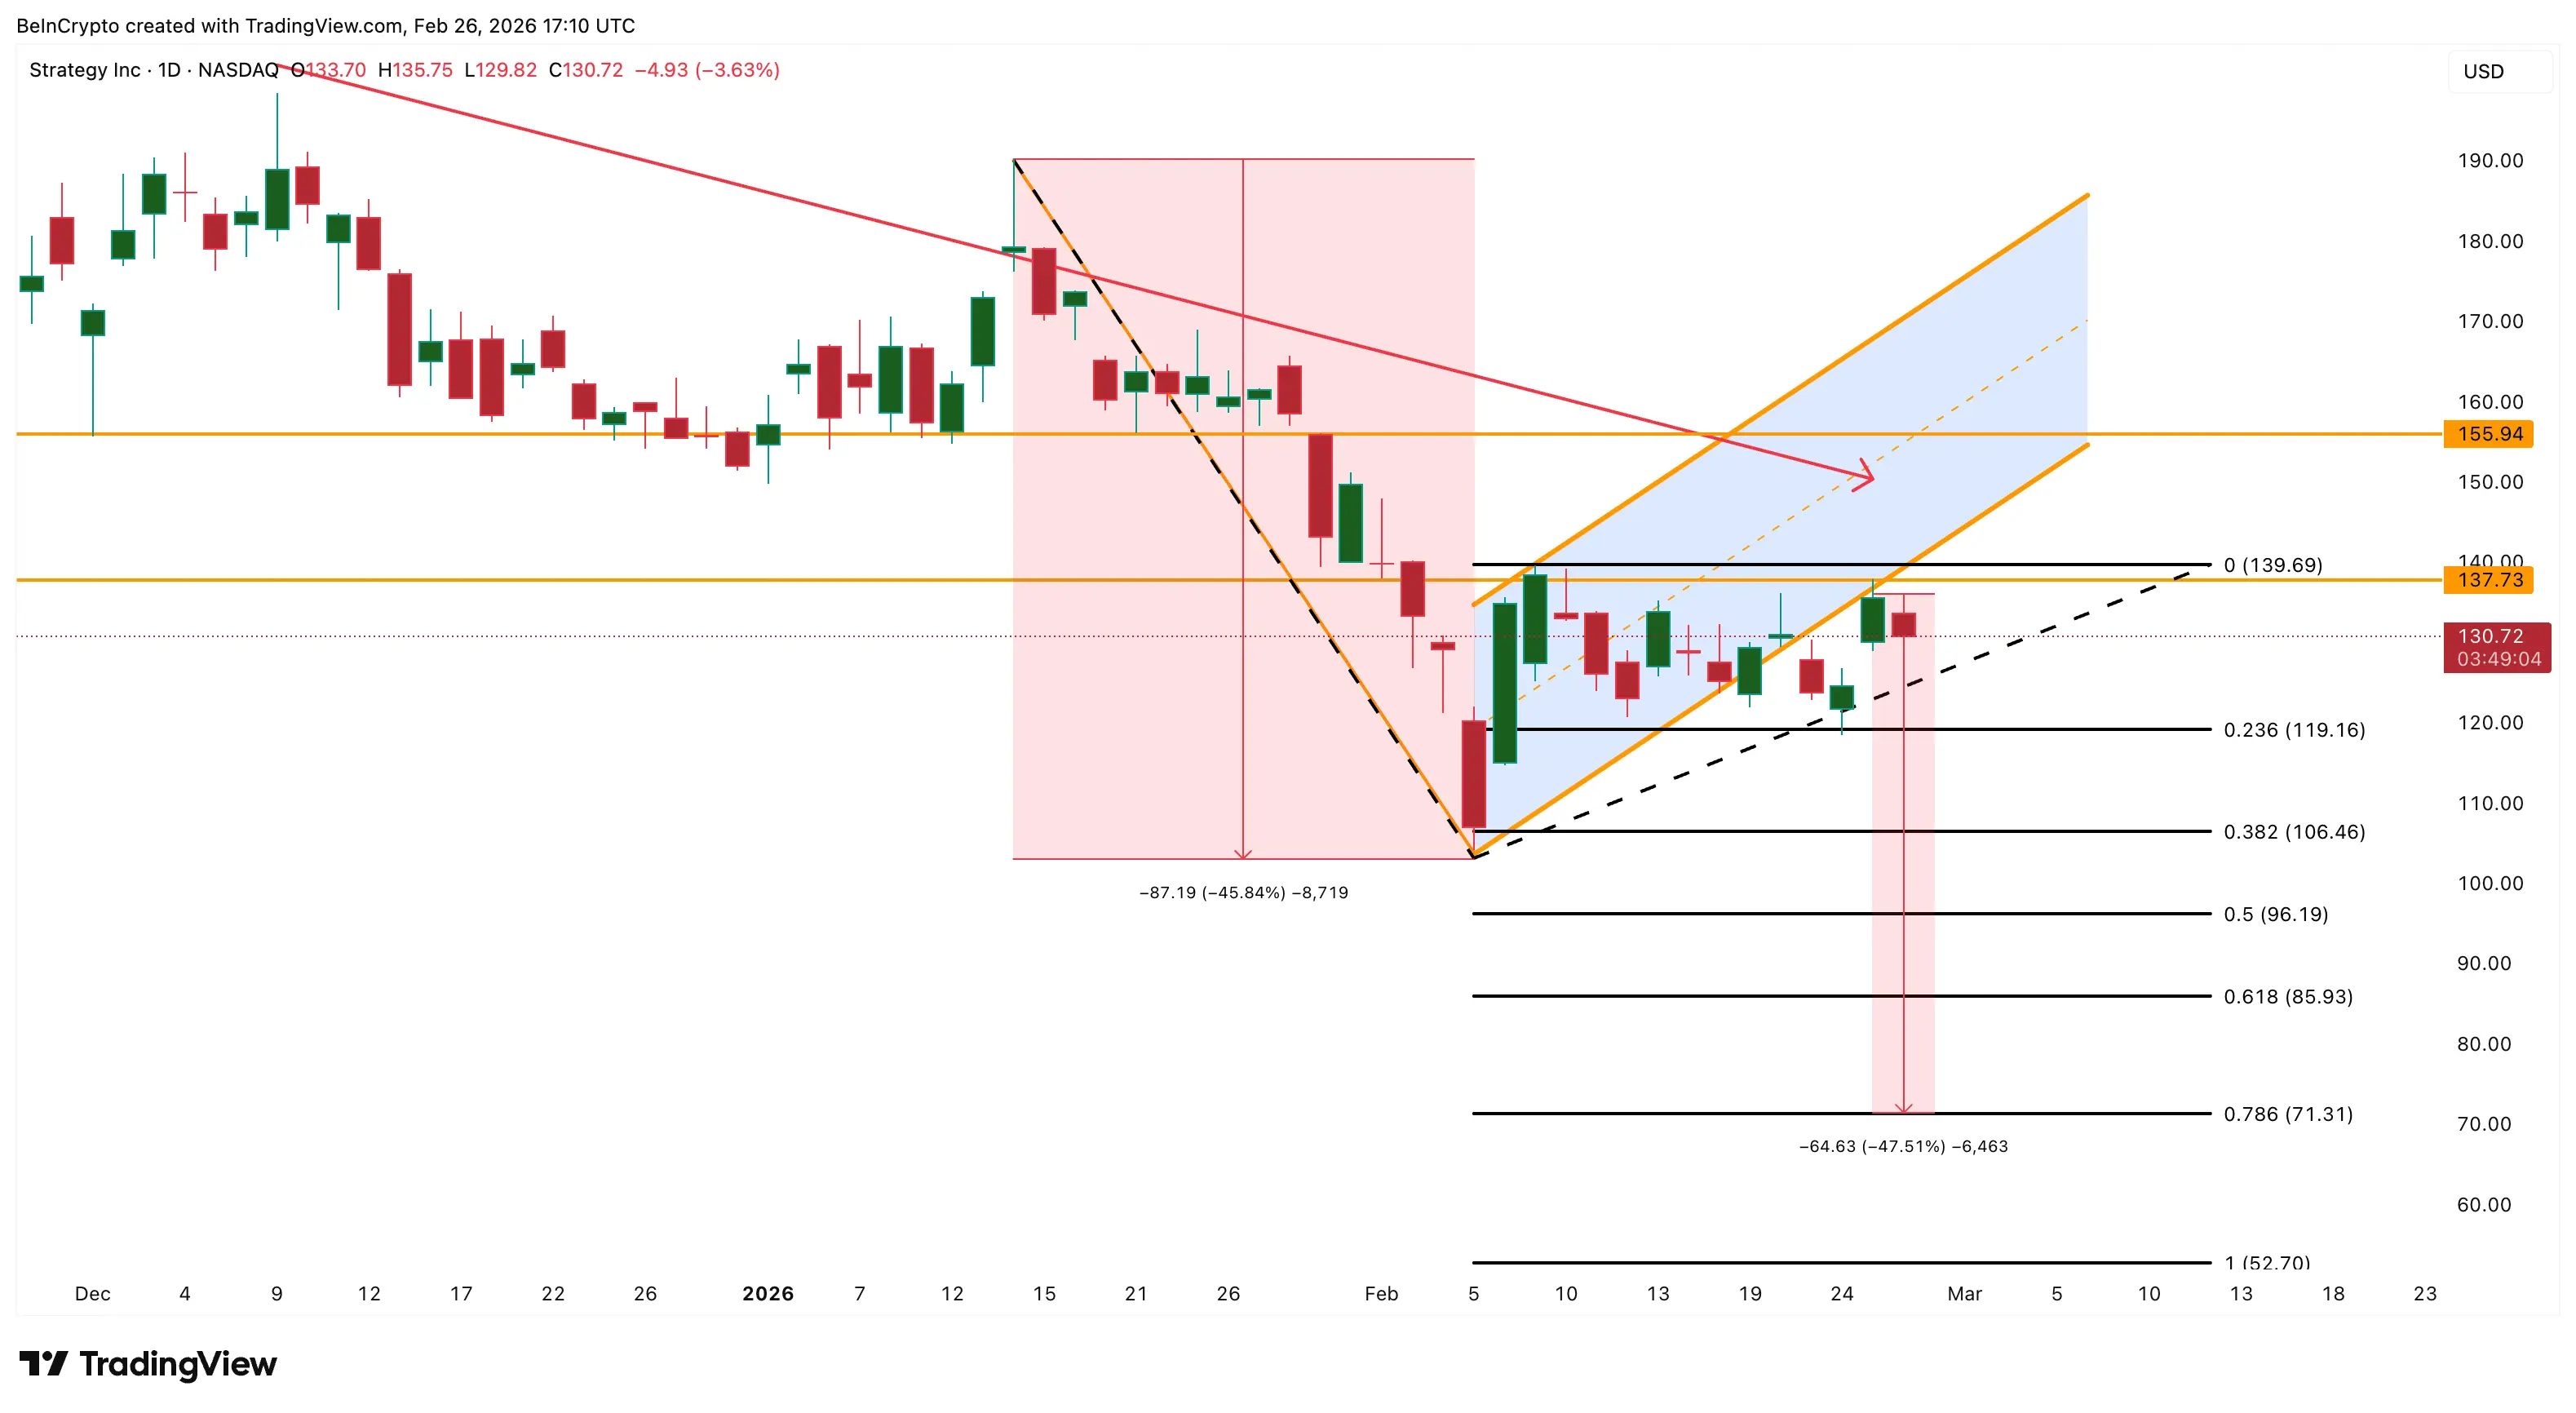
(Source: TradingView)
From a technical perspective, MSTR faces multiple pressures:
-
Bear Flag Breakdown: The bear flag pattern, formed after a larger downtrend and a brief consolidation, typically signals a new wave of strong decline upon breakdown. MSTR has completed its bear flag breakdown.
-
Bearish RSI Divergence: Between December 9 and February 25, MSTR’s price formed lower highs, while RSI formed higher highs, indicating weakening momentum. A similar divergence in January led to a 45% plunge.
-
Key Support Levels Moving Lower: The first support is at $119; if broken, next support is at $106, then $85.
-
Fibonacci Technical Target: Based on the 0.786 retracement level and extreme point projections, the full downside technical target points to approximately $70–$71, over 45% below current levels.
-
Reversal Conditions: MSTR needs to recover above $139 for a preliminary bullish signal; a confirmed breakout above $155 could break the overall bearish structure and suggest a potential trend reversal.
Frequently Asked Questions
Q: Why hasn’t MicroStrategy’s continued Bitcoin accumulation supported MSTR’s stock price?
The valuation of MSTR already includes a high premium for its Bitcoin holdings, meaning the marginal effect of additional purchases is diminishing. When Bitcoin’s overall trend weakens, MSTR’s leveraged nature causes its price to decline more sharply than Bitcoin itself. Additionally, the CMF approaching zero indicates institutional investors are not increasing their MSTR stock holdings, which is a core reason the stock cannot sustain a rebound.
Q: What does the CMF approaching zero signify for the market?
A CMF near zero indicates that institutional capital is currently in a wait-and-see mode regarding the stock—neither actively accumulating nor selling. After the prior bullish divergence triggered a 33% rebound, the rapid return of CMF to zero shows that institutional confidence has waned, serving as a key technical warning.
Q: Is the $70 downside target credible?
The $70 target is based on Fibonacci 0.786 retracement and extreme point calculations, derived after the bear flag breakdown and the loss of the $85 support. Historically, similar RSI divergences in MSTR have led to sharp declines of around 45%, indicating some reliability. However, the actual path depends on Bitcoin’s overall trend and institutional investor behavior moving forward.
Disclaimer: The information on this page may come from third parties and does not represent the views or opinions of Gate. The content displayed on this page is for reference only and does not constitute any financial, investment, or legal advice. Gate does not guarantee the accuracy or completeness of the information and shall not be liable for any losses arising from the use of this information. Virtual asset investments carry high risks and are subject to significant price volatility. You may lose all of your invested principal. Please fully understand the relevant risks and make prudent decisions based on your own financial situation and risk tolerance. For details, please refer to
Disclaimer.
Related Articles
Aster Price Nears $0.79 Breakout as Reversal Pattern Strengthens
Key Insights
Aster price structure shows an inverse head and shoulders pattern forming beneath $0.79 resistance, signaling growing buying pressure and possible trend reversal ahead.
Repeated tests of the $0.79 neckline suggest weakening selling pressure as buyers steadily absorb supply
CryptoFrontNews24m ago
The HYPE price could surge despite the upcoming $2.8 million short squeeze.
The recent price movements of Hyperliquid (HYPE) are characterized by stagnation around 30 USD. A symmetrical triangle pattern indicates potential for a breakout in either direction, but market sentiment is cautious. Short squeeze risks may boost prices, while weak market flow and deteriorating demand pose challenges. The token could face significant support levels if it dips below 30 USD. An improved market sentiment could lead to a breakout above 33 USD, sparking recovery momentum.
TapChiBitcoin37m ago
Ethereum Price Holds Key Support: Is $2,200 the Next Test for ETH?
March 6, 2026 7:15 pm EST
TheCoinRepublic2h ago
Cardano Price Trends: Bulls Eye Opportunity as Indicator Flashes Green
ADA: Trading near $0.27, facing resistance at $0.28 and support at $0.26.
Technical Indicators: RSI and MACD show weak momentum, signaling short-term consolidation and cautious trading.
Macro Outlook: Rising PMI and historical patterns suggest potential bullish rebound if resistance
CryptoNewsLand3h ago
CryptoQuant: Bitcoin NUPL--MVRV indicator reaches 0.33, or has entered the mid-stage of a bear market
Gate News Announcement, March 7th, CryptoQuant analyst Axel pointed out on the X platform that the Bitcoin NUPL--MVRV harmonic composite indicator has reached 0.33, while historical cycle bottoms typically occur around the 0.5 range. The chart shows that the bear market cycle is beginning to shift upward, indicating that Bitcoin may have entered the mid-stage of this bear market cycle, suggesting that extreme selling conditions are easing. However, this indicator is still well above historical bottom levels, implying that a market-wide bottom has not yet been confirmed.
GateNews3h ago
ZEC Price Analysis: Upcoming Trends and Targets for the Next Few Weeks
ZEC: Stabilized near $200 support, rebounding toward $250 resistance after prolonged bearish pressure.
Technical Indicators: RSI and MACD show gradual improvement, signaling moderate bullish momentum returning.
Market Outlook: Sustained above $240 could push ZEC toward $268, while
CryptoNewsLand4h ago