
Bitcoin (BTC) surged over the weekend after dropping sharply to around $63,000 amid tensions from the US-Iran military conflict. Since Monday, it has rebounded approximately 6.5% from its lows, climbing back to the $67,000 level as diplomatic signals emerged. U.S. President Trump told the media that he might consider easing sanctions if Iran’s new leadership demonstrates “pragmatism”; The Wall Street Journal also cited officials indicating that Iran’s security chief is attempting to restart dialogue through mediators in Oman.
The rebound behind: diplomatic signals and a fragile cross-asset environment
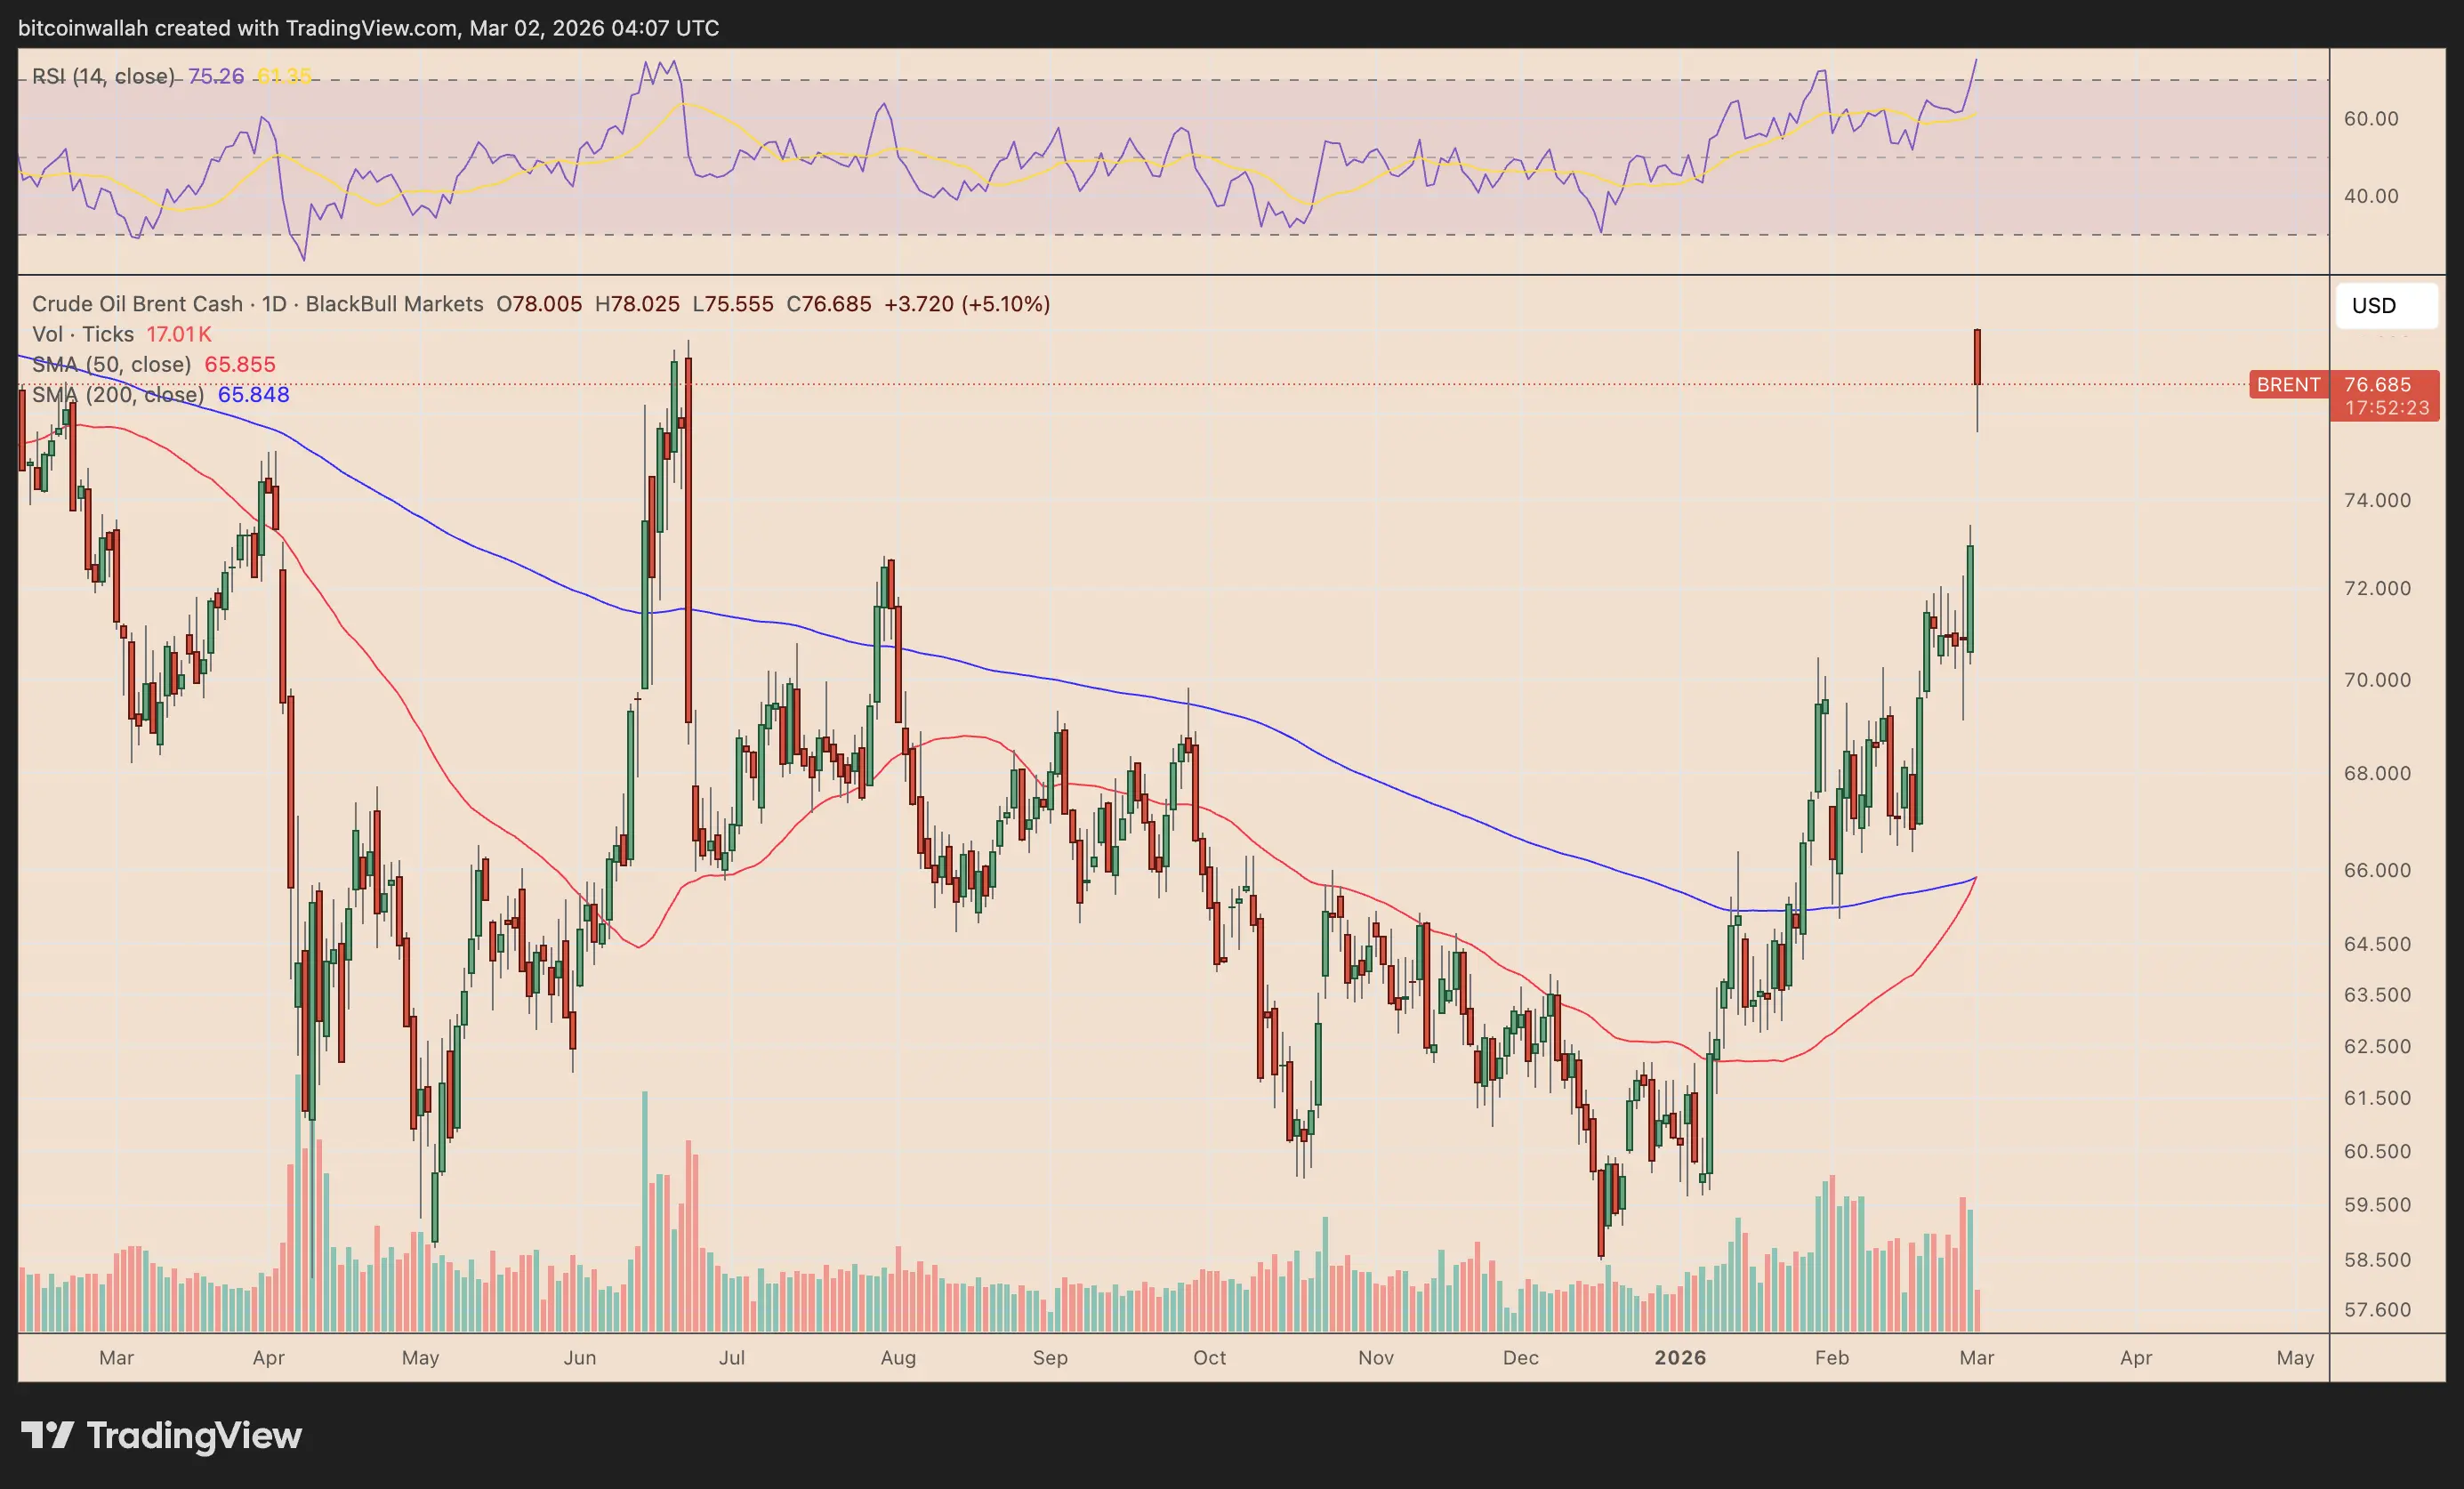
(Source: TradingView)
This Bitcoin rebound is not rooted in solid fundamental improvements but is mainly driven by early diplomatic signals. Although oil and gold prices have retreated from conflict-related highs, they remain at relatively elevated levels supported by supply shocks and safe-haven demand, indicating that the market has not fully priced out geopolitical risk premiums.
This market structure suggests that Bitcoin’s current rally is quite fragile—if negative developments occur again in Iran or U.S. economic data this week surpasses expectations, risk aversion could once again suppress risk assets. Bitcoin, being sensitive to interest rate environments, often exhibits high beta characteristics of “liquidity assets”: strong economic data can push yields higher, making it harder for Bitcoin to sustain gains; conversely, weak data interpreted as concerns over economic growth rather than clear deflation signals could also lead to significant market volatility.
Key Data Calendar for This Week
Beyond the macro backdrop of US-Iran tensions, this week’s US economic data will influence the Federal Reserve’s rate expectations ahead of the March 17-18 meeting:
- March 2 (Monday): ISM Manufacturing Report — reflects industrial activity momentum and could quickly reshape market perceptions of economic growth.
- March 4 (Wednesday): ADP Private Payrolls + ISM Services Report — dual labor market indicators that typically influence institutional rate positioning.
- March 6 (Friday, 8:30 AM EST): Non-Farm Payrolls (NFP) — the most critical data point, directly impacting US Treasury yields and dollar trends, which in turn influence Bitcoin.
Among these reports, non-farm payrolls have the greatest market impact: if employment data exceeds expectations, yields may rise, putting pressure on Bitcoin; if below expectations, markets may reprice rate cut expectations, though the reaction depends on whether traders interpret the data as healthy cooling or recession signals.
Technical Analysis: Bear Flag Pattern and Key Support Targets
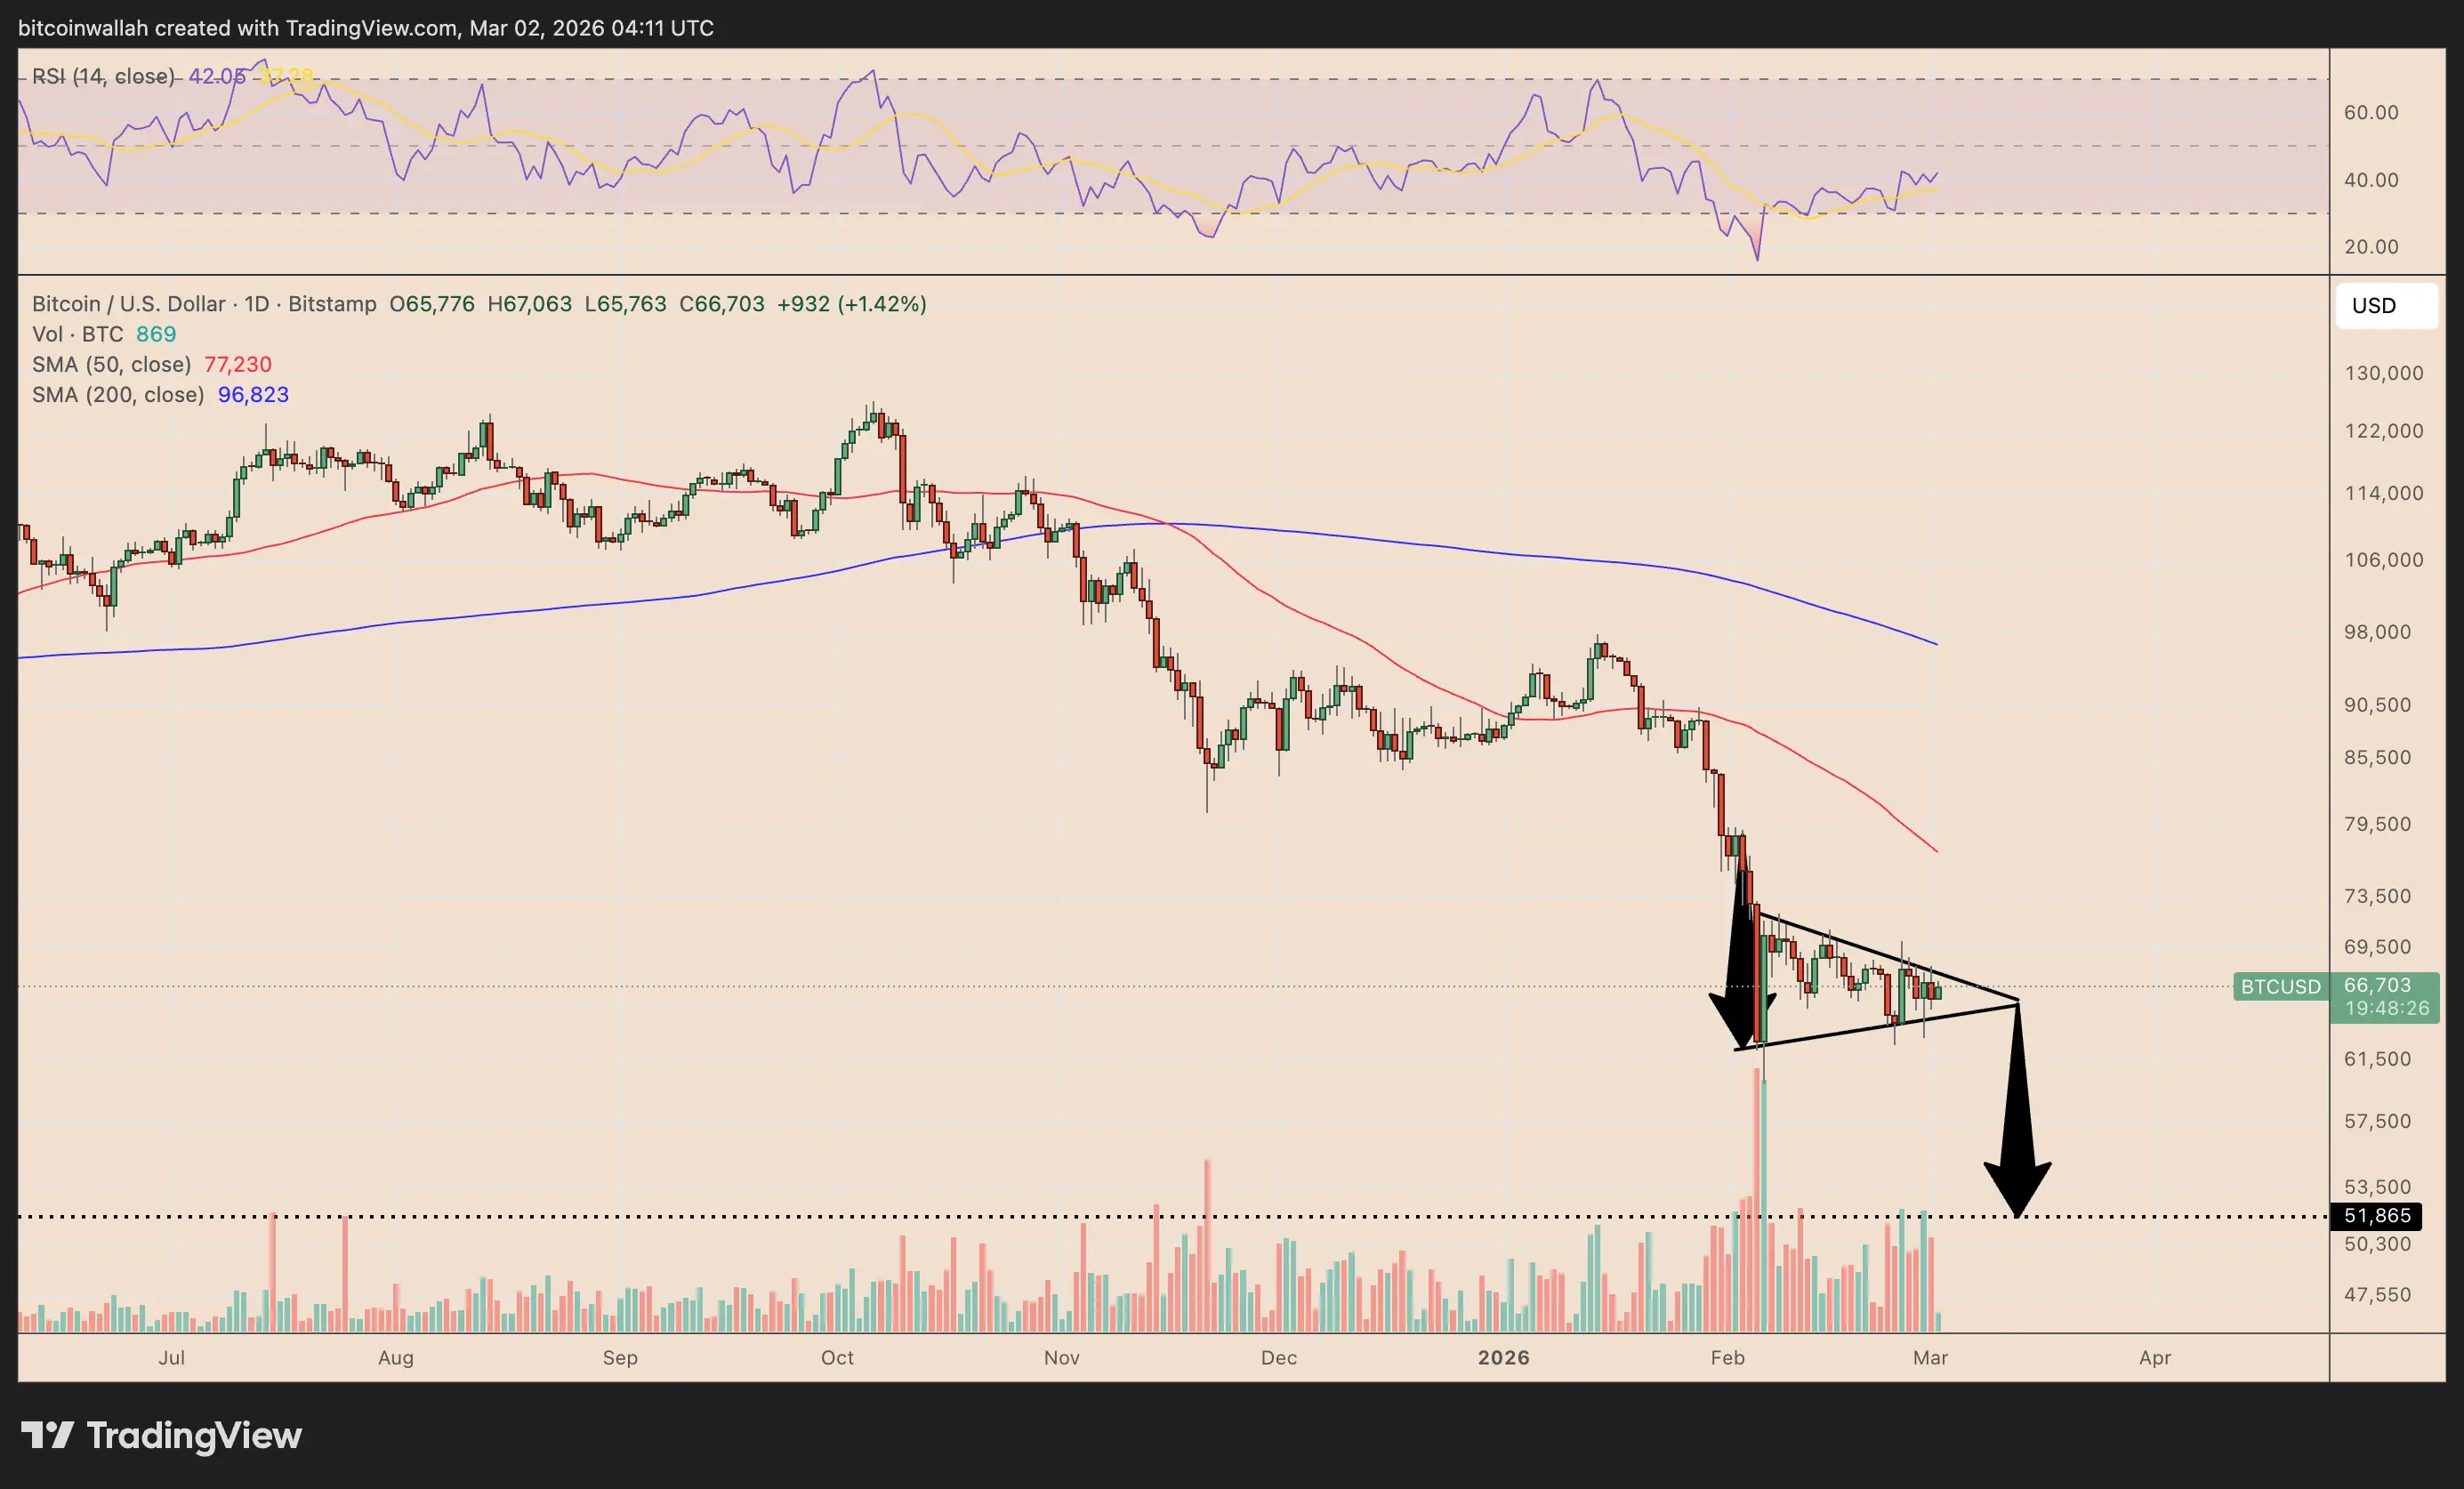
(Source: TradingView)
The daily chart shows that after a rapid decline from highs of $73,000–$74,000 down to around $63,000, a bear flag pattern is forming. This pattern, created by prior trend compression, typically extends in the original direction after consolidation, according to technical analysis principles.
Key levels indicated by technical analysis:
- Expected range this week: Support at $63,000; resistance between $67,000 and $69,000.
- Downward breakout (measured move) target: approximately $52,000, aligning with the chart’s support zone around $51,865.
- Reversal confirmation: A sustained and effective break above $69,000 is needed to technically weaken the bear flag structure.
FAQs
Q: Why haven’t signals of easing US-Iran tensions triggered a larger Bitcoin rally?
Currently, diplomatic contacts are still in early exploratory stages. Oil and gold prices remain high, and the market has not fully priced in the resolution of the conflict. Additionally, safe-haven sentiment across assets persists, and upcoming key US data adds uncertainty, causing institutional investors to remain cautious and avoid increasing risk exposure before clarity.
Q: How do non-farm payrolls influence Bitcoin?
Non-farm payrolls directly impact the Fed’s rate expectations through immediate market pricing. Strong data typically pushes yields higher and strengthens the dollar, exerting pressure on high-volatility risk assets like Bitcoin. Weak data may reignite expectations of rate cuts, which could benefit Bitcoin and similar assets. However, if weak data signals recession fears, overall risk aversion may suppress Bitcoin’s upside.
Q: Does the $52,000 target from the bear flag pattern mean Bitcoin will necessarily fall to that level?
The $52,000 target is derived from the measured move technique, based on the magnitude of the previous decline. It’s a technical reference point, not a guaranteed outcome. The actual trend depends on macroeconomic data this week, developments in US-Iran diplomacy, and overall market risk sentiment. If Bitcoin can hold above $63,000 and break above $69,000, the bearish flag’s downside projection could be invalidated.
Disclaimer: The information on this page may come from third parties and does not represent the views or opinions of Gate. The content displayed on this page is for reference only and does not constitute any financial, investment, or legal advice. Gate does not guarantee the accuracy or completeness of the information and shall not be liable for any losses arising from the use of this information. Virtual asset investments carry high risks and are subject to significant price volatility. You may lose all of your invested principal. Please fully understand the relevant risks and make prudent decisions based on your own financial situation and risk tolerance. For details, please refer to
Disclaimer.
Related Articles
Polkadot to Reset Tokenomics on March 12 With Major DOT Supply and Staking Changes
Polkadot will introduce a new monetary framework on March 12 that sets DOT’s supply cap at 2.1 billion and lowers emissions by 53.6%.
The overhaul will also create a Dynamic Allocation Pool and shorten the DOT unbonding period from 28 days to 24–48 hours.
On March 12, Polkadot will reset
CryptoNewsFlash49m ago
Bitcoin May Be Closer to a Bottom Than Most Think, Chart Signals
The Bitcoin price slipped about 2% today, trading slightly below $68,000 after pushing above $73,000 earlier this week, as already covered on our site. The move added fresh pressure to a market that still feels shaky, especially after several failed attempts to hold higher levels.
Still, not e
CaptainAltcoin1h ago
Dogecoin Monthly Breakdown Pattern Reappears as Price Tests $0.0918
Dogecoin is currently trading at $0.09205 at a gain of 2.3, with support of above $0.08878.
As can be seen in the monthly chart, there are recurring breakdown areas that have been followed by significant expansions in price.
The short-term trading range is narrow and the immediate point o
CryptoNewsLand1h ago
Solana Eyes $90.6 Trigger Point as $83 Support Holds and Liquidation Pressure Builds
A large cluster of short positions faces liquidation if SOL reaches $90.6, potentially increasing volatility.
SOL trades between $83.00 support and $89.58 resistance, keeping price action compressed in the short term.
SOL posts a 0.8% daily gain and rises 0.7% against BTC, holding
CryptoNewsLand1h ago
Crypto Market Plunges As Extreme Fear Controls Investor Sentiment
The global crypto market is notably bearish, with a 2.93% drop in market capitalization to $2.32T. Bitcoin and Ethereum saw decreases of 3.07% and 4.01%, respectively. Meanwhile, notable gainers include $XBTC, $TRUMP, and $PEPE. DeFi TVL and NFT sales also declined significantly, while key investments from YZi Labs and Kazakhstan's central bank emerged.
BlockChainReporter1h ago
HBAR at a Crossroads: Will $0.095 Support Trigger a Break Toward $0.106?
HBAR is trading at $0.09739 and above the S/R flip of $0.094-$0.096 in the 12H chart.
The nearest resistance will be at $0.10 with a falling trendline pressure at around $0.104-$0.106.
The support is at $0.095835 and a breakdown at the
CryptoNewsLand2h ago