The price of Solana (SOL) is experiencing slight profit-taking pressure as it approaches the upper boundary of the accumulation zone around the $88 mark during Wednesday’s trading session. However, support from institutional funds is becoming increasingly evident as spot ETF funds record two consecutive inflow sessions since the beginning of the week, strengthening the foundation for a recovery trend.
On the technical side, if SOL can convincingly close above the current accumulation zone, a breakout scenario will open up, paving the way for a short-term upward rally.
Increasing Institutional Demand
Institutional demand for Solana continues to maintain a positive outlook this week. According to data from SoSoValue, SOL spot ETF funds recorded an inflow of $1.03 million on Tuesday, after attracting $17.41 million in the previous session, bringing the total accumulated capital from the start of the week to $18.44 million.
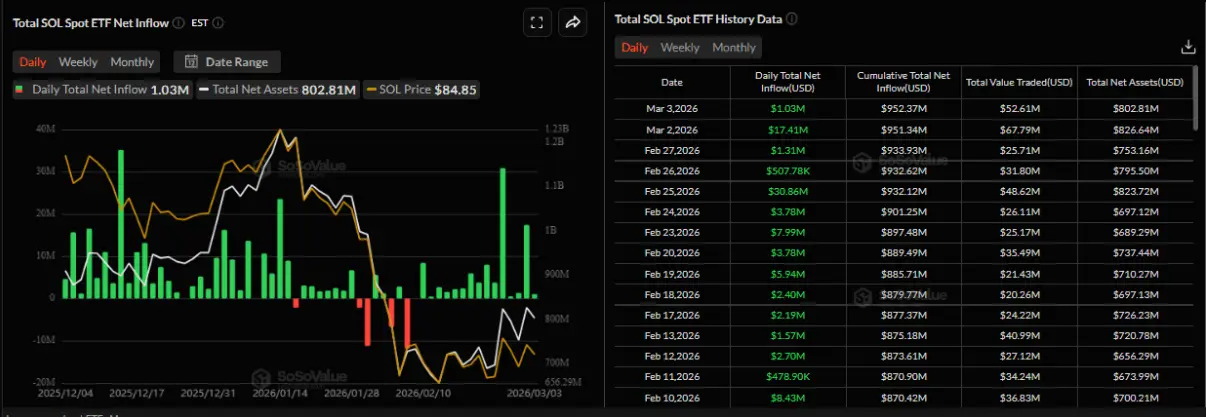 Daily net capital flow chart into Solana spot ETF | Source: SoSoValue Notably, the capital inflow trend is not only short-term. Last week, these funds recorded $44.44 million — the highest since mid-January — indicating growing interest from institutional investors. If the inflow momentum continues to strengthen, SOL could enter a new upward phase in the coming weeks.
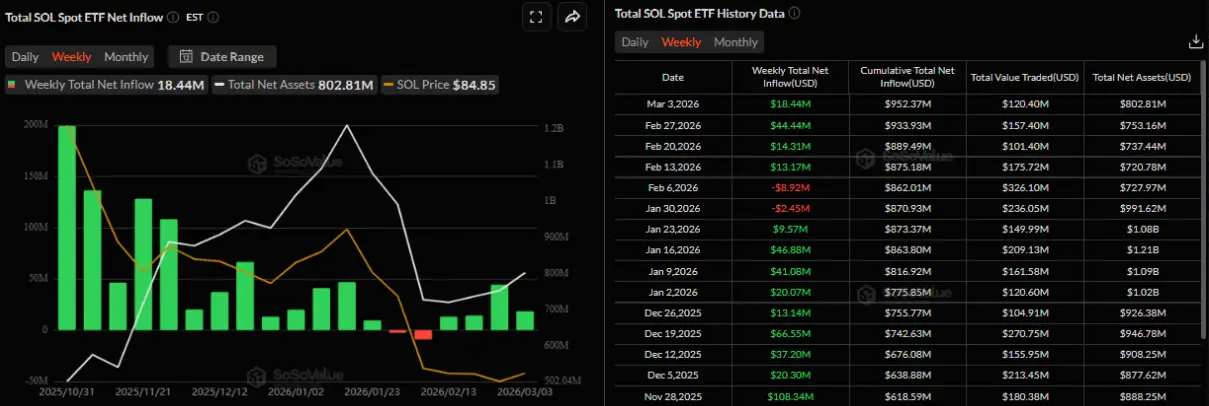 Weekly net capital flow chart into Solana spot ETF | Source: SoSoValue In the derivatives market, data from CoinGlass also signals optimism. The funding rate index turned positive on Wednesday, reaching 0.0008%, meaning long traders are paying fees to short traders. This development reflects positive investor sentiment regarding SOL’s short-term prospects.
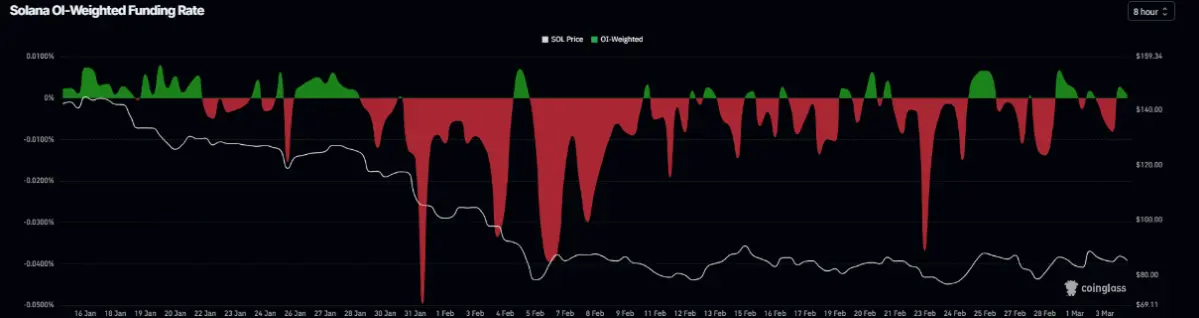 Solana funding rate chart | Source: Coinglass## Solana Price Forecast: SOL Approaching a Key Resistance Zone
At the time of writing on Wednesday, Solana (SOL) has slightly retreated to around $85.41, indicating a state of consolidation but still leaning bearish in the short term. The price remains below the upper boundary of the parallel channel around $87.96 and faces downward pressure from the long-term descending trendline from the $253.51 high — a sign that the bears still hold the control.
Daily candles continue to close below the 50-day and 100-day EMAs, which are now converging above the $98 level. This keeps the overall picture under pressure, despite a technical rebound from the lower boundary of the channel around $77.60.
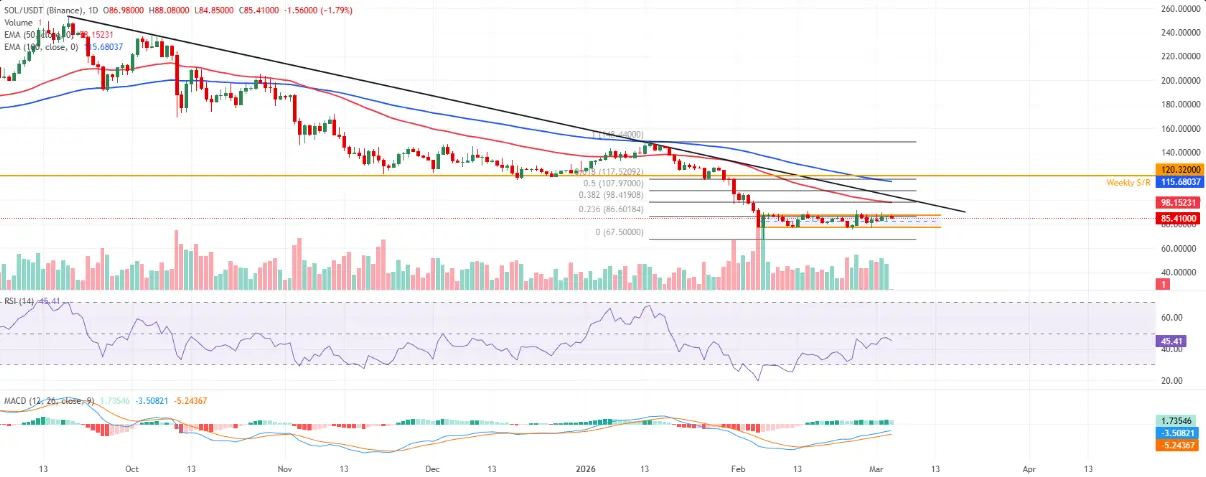 Daily chart of SOL/USDT | Source: TradingView In terms of momentum, the signals have become less negative. The daily RSI has recovered to the mid-40s after leaving oversold territory, while the MACD lines remain above zero, indicating a slowdown in the downward momentum. However, the main trend has not yet reversed.
The nearest resistance is at the 23.6% Fibonacci level at $86.60 (measured from the $67.50 low to the $148.44 high). If broken, SOL could target the 38.2% level at $98.42 — coinciding with the 50-day EMA, which is considered a notable supply zone.
Conversely, immediate support remains at the channel bottom around $77.60, followed by the previous low of $67.50 — also an important Fibonacci anchor point. Whether buying pressure will be strong enough here to halt the current downtrend or if the market will enter a new accumulation phase depends on the strength of demand at these levels.
Disclaimer: The information on this page may come from third parties and does not represent the views or opinions of Gate. The content displayed on this page is for reference only and does not constitute any financial, investment, or legal advice. Gate does not guarantee the accuracy or completeness of the information and shall not be liable for any losses arising from the use of this information. Virtual asset investments carry high risks and are subject to significant price volatility. You may lose all of your invested principal. Please fully understand the relevant risks and make prudent decisions based on your own financial situation and risk tolerance. For details, please refer to
Disclaimer.
Related Articles
5 Best Crypto to Buy Now: Pepeto Leads as ETH, SOL, and XRP Surge 8% on Easing War Fears and $700M Floods ETFs
Ether surged 7.5%, Solana added 5.3%, XRP jumped 8%, and Dogecoin popped 7.5% as global equities rebounded and $700 million flooded into US spot bitcoin ETFs since March began, and when the entire market moves this violently higher.
While the Fear and Greed Index still reads extreme fear it m
CaptainAltcoin16m ago
SOL Strategies Shares Soar 21% as February Update Highlights Validator Growth
SOL Strategies Inc. reported significant growth in February 2026, with its shares jumping 20.97% following its business update. The firm expanded its Solana validator network to over 33,500 wallets, generated 1,276 SOL in net revenue, and achieved a peak Annual Percentage Yield of 6.47%.
TheNewsCrypto3h ago
Western Union partners with Crossmint to launch the USD stablecoin USDPT on Solana
Odaily Planet Daily reports that Western Union and Crossmint have partnered to launch the USDPT stablecoin on the Solana blockchain. (Solid Intel)
GateNews7h ago
Solana and XRP prices stabilize, US employment report may trigger a new round of crypto market volatility
Solana and XRP prices are gradually stabilizing after market fluctuations, with traders focusing on the upcoming U.S. employment report. Solana is close to $90.9, and a breakthrough of $95 could push it toward $100; XRP is around $1.42, and increased buying pressure could push it up to $1.50. The movements of both are influenced by employment data, and analysts believe this will be a key catalyst.
GateNews7h ago

