Bitcoin traded at $70,795 on March 14, 2026, with a market capitalization of $1.41 trillion and 24-hour trading volume of $49.48 billion. The cryptocurrency moved within an intraday range between $70,416 and $73,838 while technical indicators across major timeframes reflected a neutral market structure.
Bitcoin Chart Outlook
On the daily chart, bitcoin continues to trade inside a consolidation range following a rejection near the $74,000 resistance zone. Current price levels around $70,467 on Bitstamp place the asset in the middle of a broader visible trading band between approximately $63,000 and $77,500.
Market structure reflects sideways movement with declining volatility after the rejection near recent highs. Key resistance remains between $73,800 and $74,000, while mid-range resistance sits near $71,200. Support is identified around $69,500, with stronger structural support near $66,000. As long as the price remains above the $69,500 level, the broader bias remains neutral to slightly upward within the existing range.
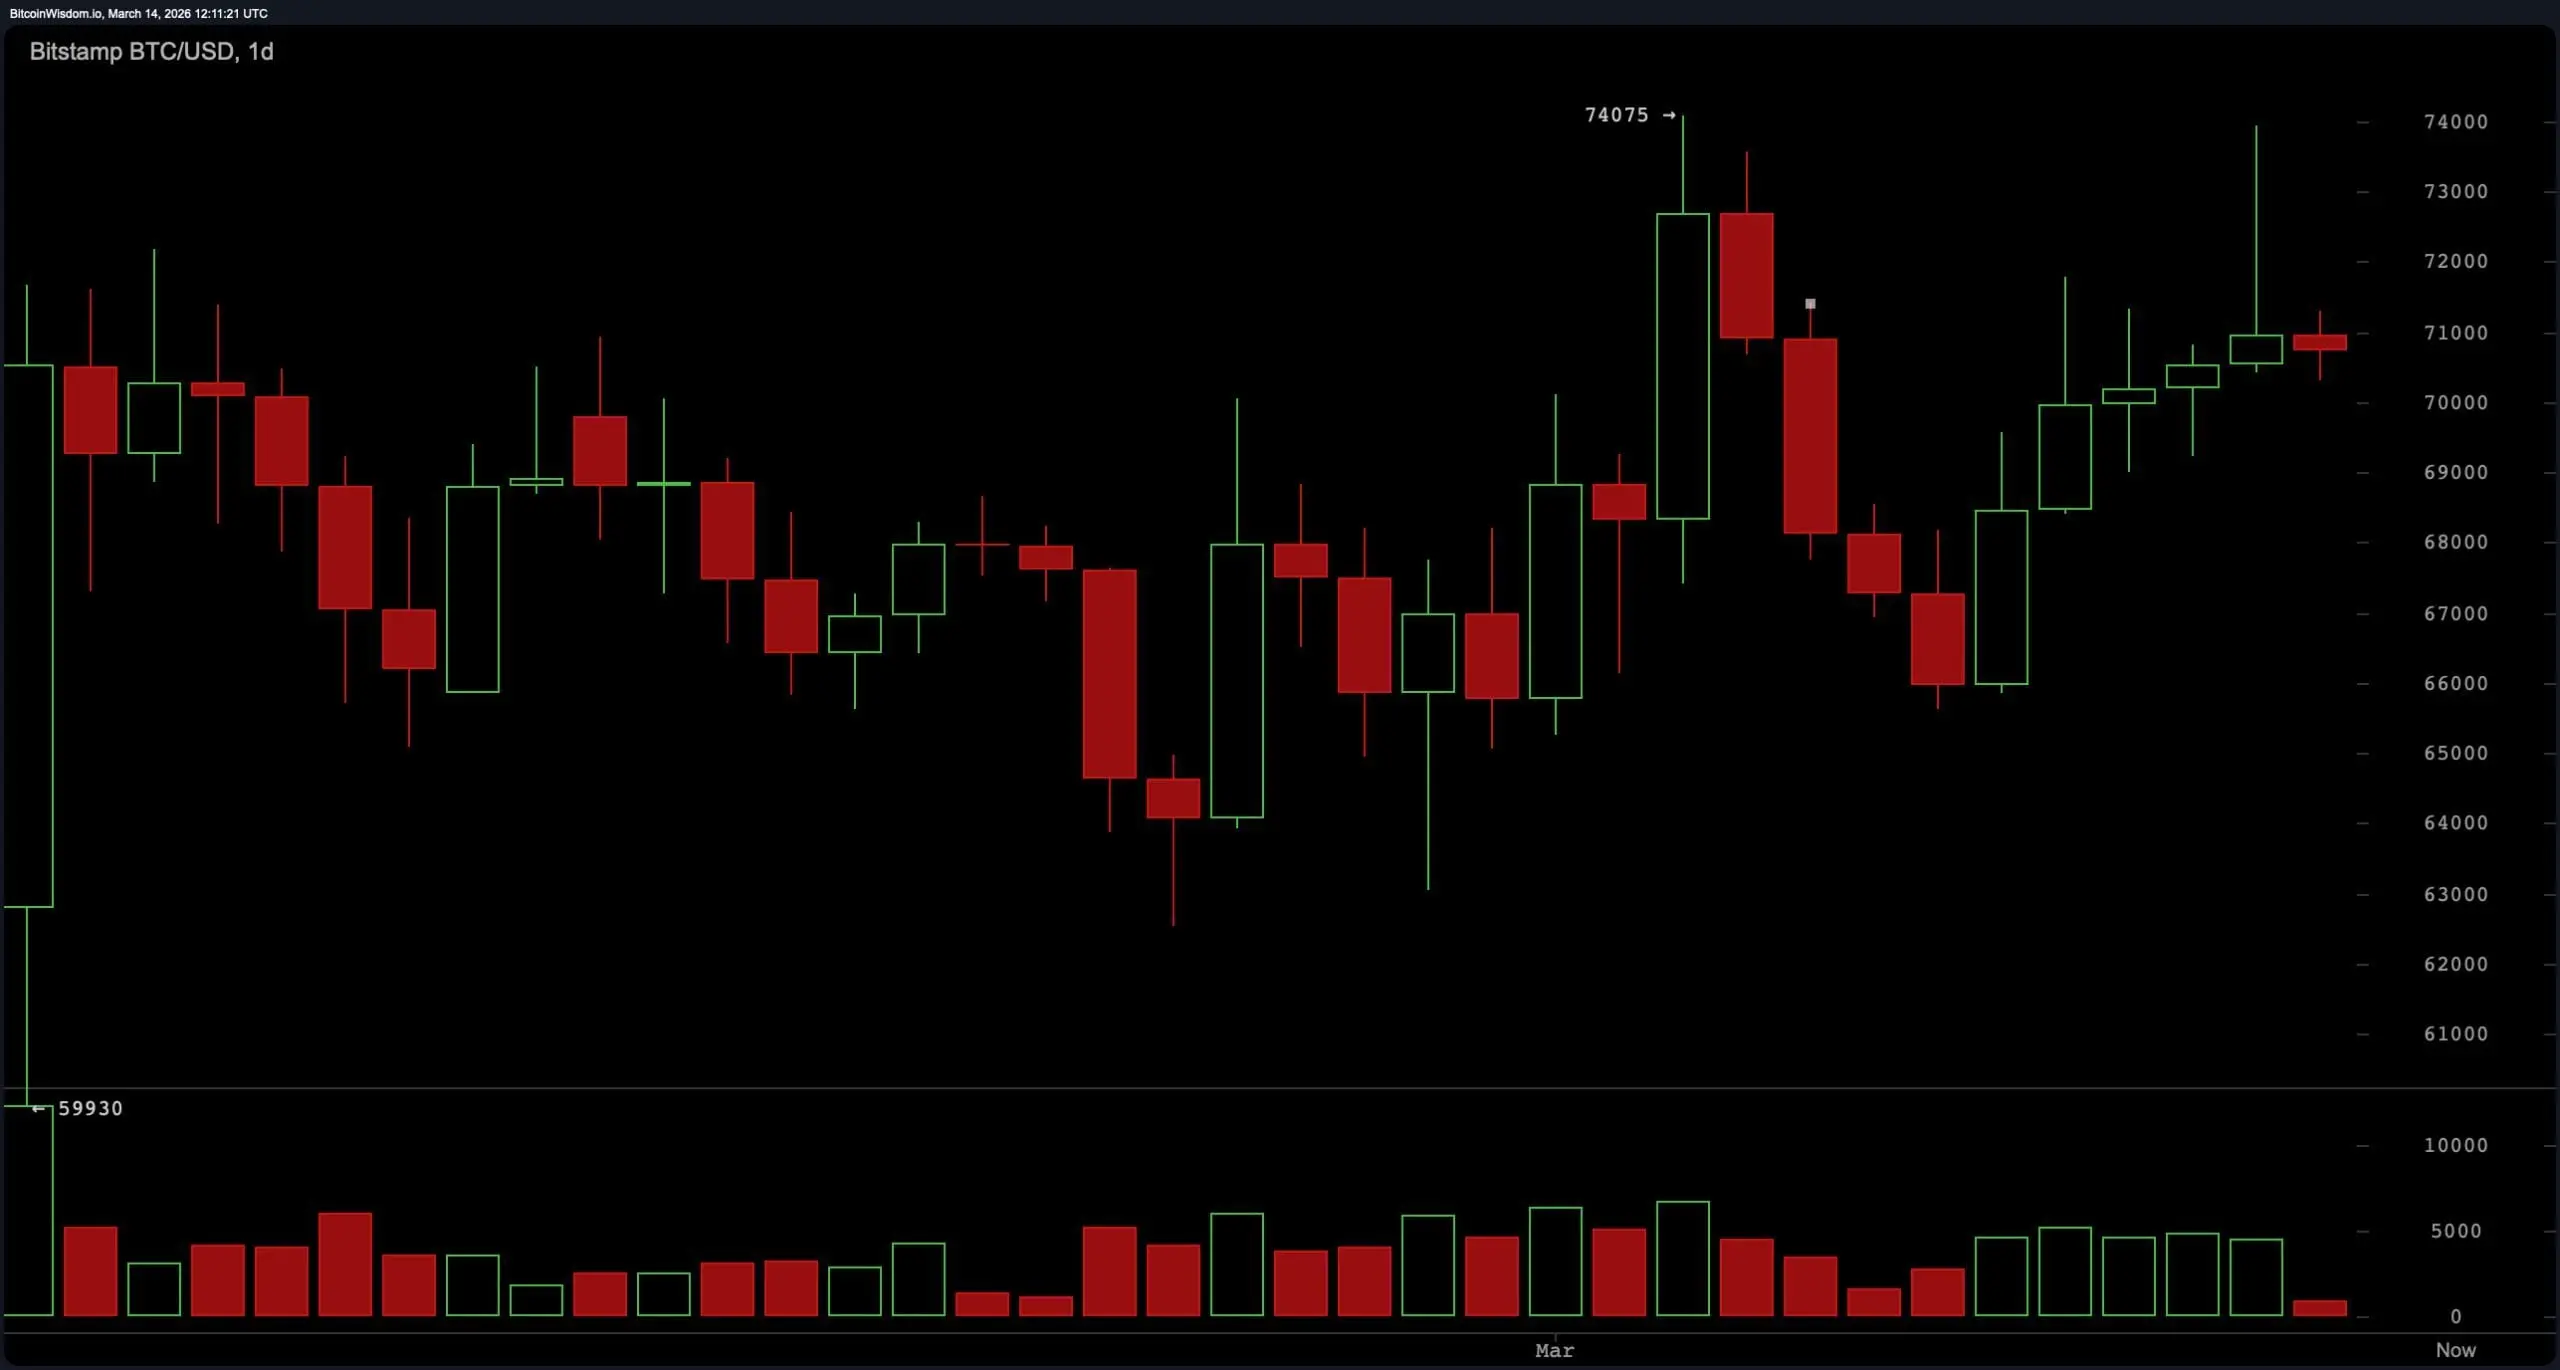 BTC/USD 1-day chart via Bitstamp on March 14, 2026.
The four-hour bitcoin chart shows continued sideways consolidation supported by a sequence of higher lows. Previous swing levels progressed from approximately $65,600 to $69,000 and then to near $70,000, suggesting gradual upward pressure beneath resistance. Price has repeatedly encountered resistance between $71,500 and $72,000, creating a compression pattern as volatility narrows. This type of price structure often precedes expansion once resistance or support is decisively breached. The current compression below resistance indicates that a move beyond this zone could determine the next directional move of roughly $3,000 to $5,000.
BTC/USD 1-day chart via Bitstamp on March 14, 2026.
The four-hour bitcoin chart shows continued sideways consolidation supported by a sequence of higher lows. Previous swing levels progressed from approximately $65,600 to $69,000 and then to near $70,000, suggesting gradual upward pressure beneath resistance. Price has repeatedly encountered resistance between $71,500 and $72,000, creating a compression pattern as volatility narrows. This type of price structure often precedes expansion once resistance or support is decisively breached. The current compression below resistance indicates that a move beyond this zone could determine the next directional move of roughly $3,000 to $5,000.
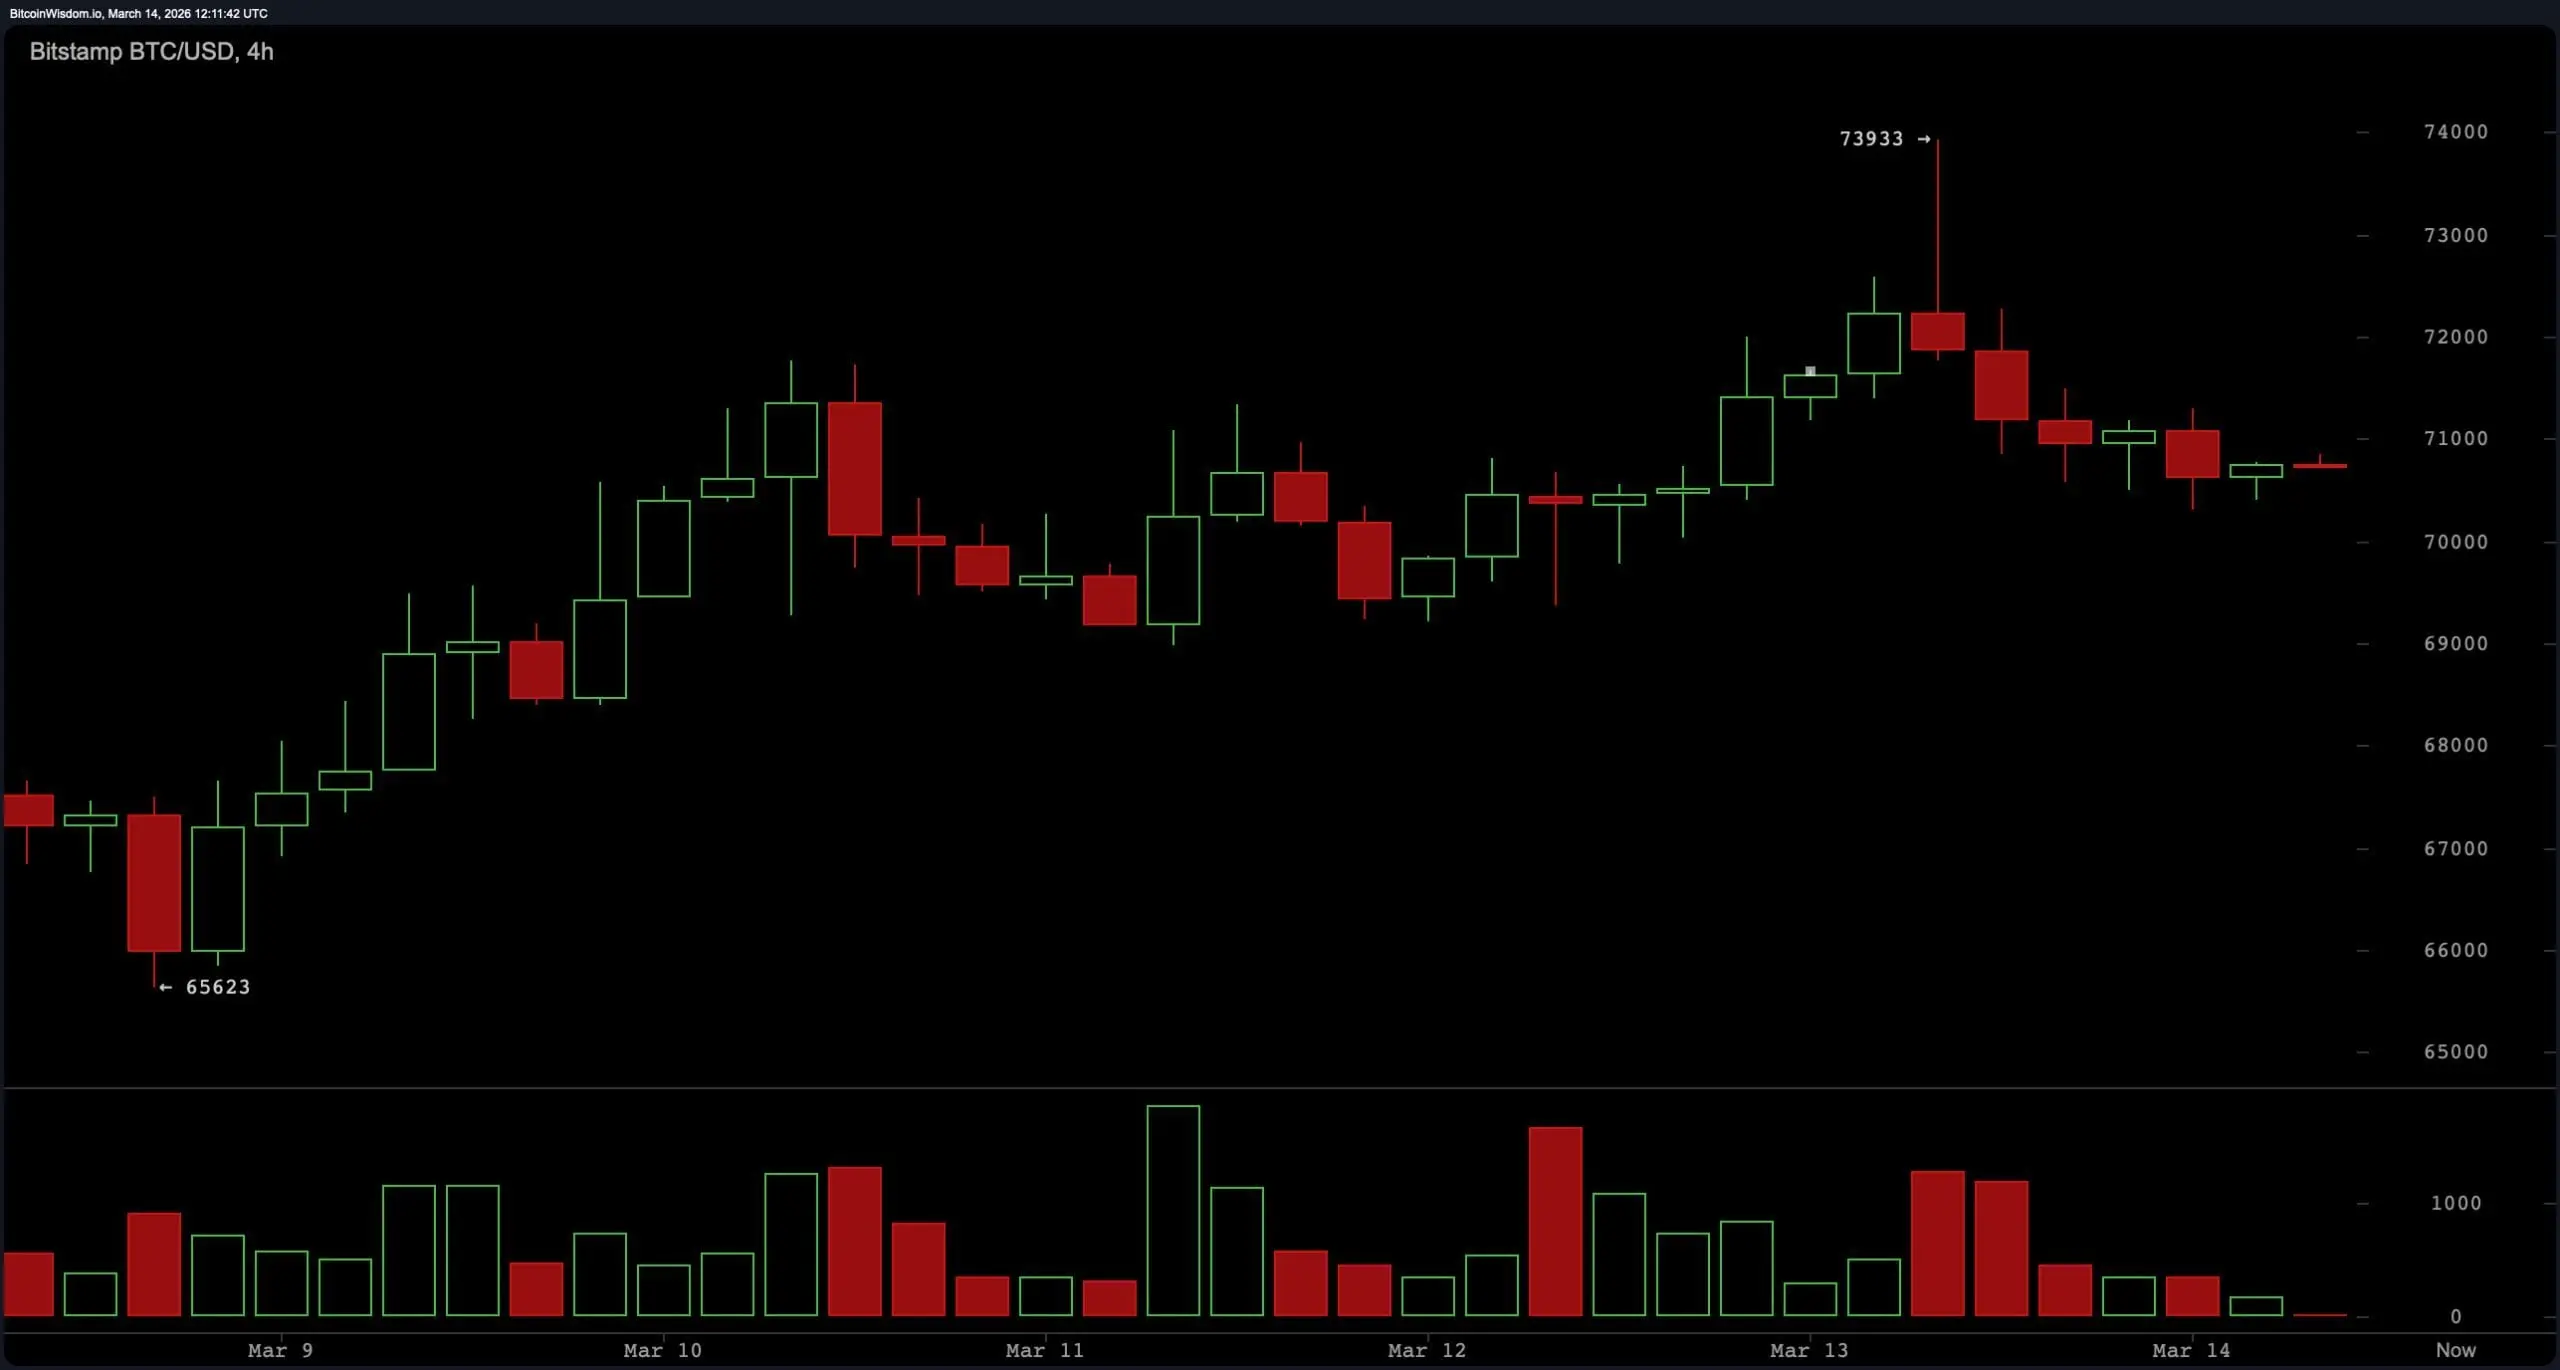 BTC/USD 4-hour chart via Bitstamp on March 14, 2026.
On the one-hour chart, bitcoin is trading within a tight intraday range between $70,300 support and approximately $71,100 resistance. Price movement has remained contained inside this narrow band while trading volume gradually declines, reflecting short-term equilibrium between buyers and sellers. Intraday consolidation within this range suggests the market is awaiting a catalyst for a breakout. Sustained movement above the $71,200 level would place the price near the upper resistance band around $72,800 and $74,000, while a breakdown below $69,500 would expose lower support areas near $67,800 and $66,000.
BTC/USD 4-hour chart via Bitstamp on March 14, 2026.
On the one-hour chart, bitcoin is trading within a tight intraday range between $70,300 support and approximately $71,100 resistance. Price movement has remained contained inside this narrow band while trading volume gradually declines, reflecting short-term equilibrium between buyers and sellers. Intraday consolidation within this range suggests the market is awaiting a catalyst for a breakout. Sustained movement above the $71,200 level would place the price near the upper resistance band around $72,800 and $74,000, while a breakdown below $69,500 would expose lower support areas near $67,800 and $66,000.
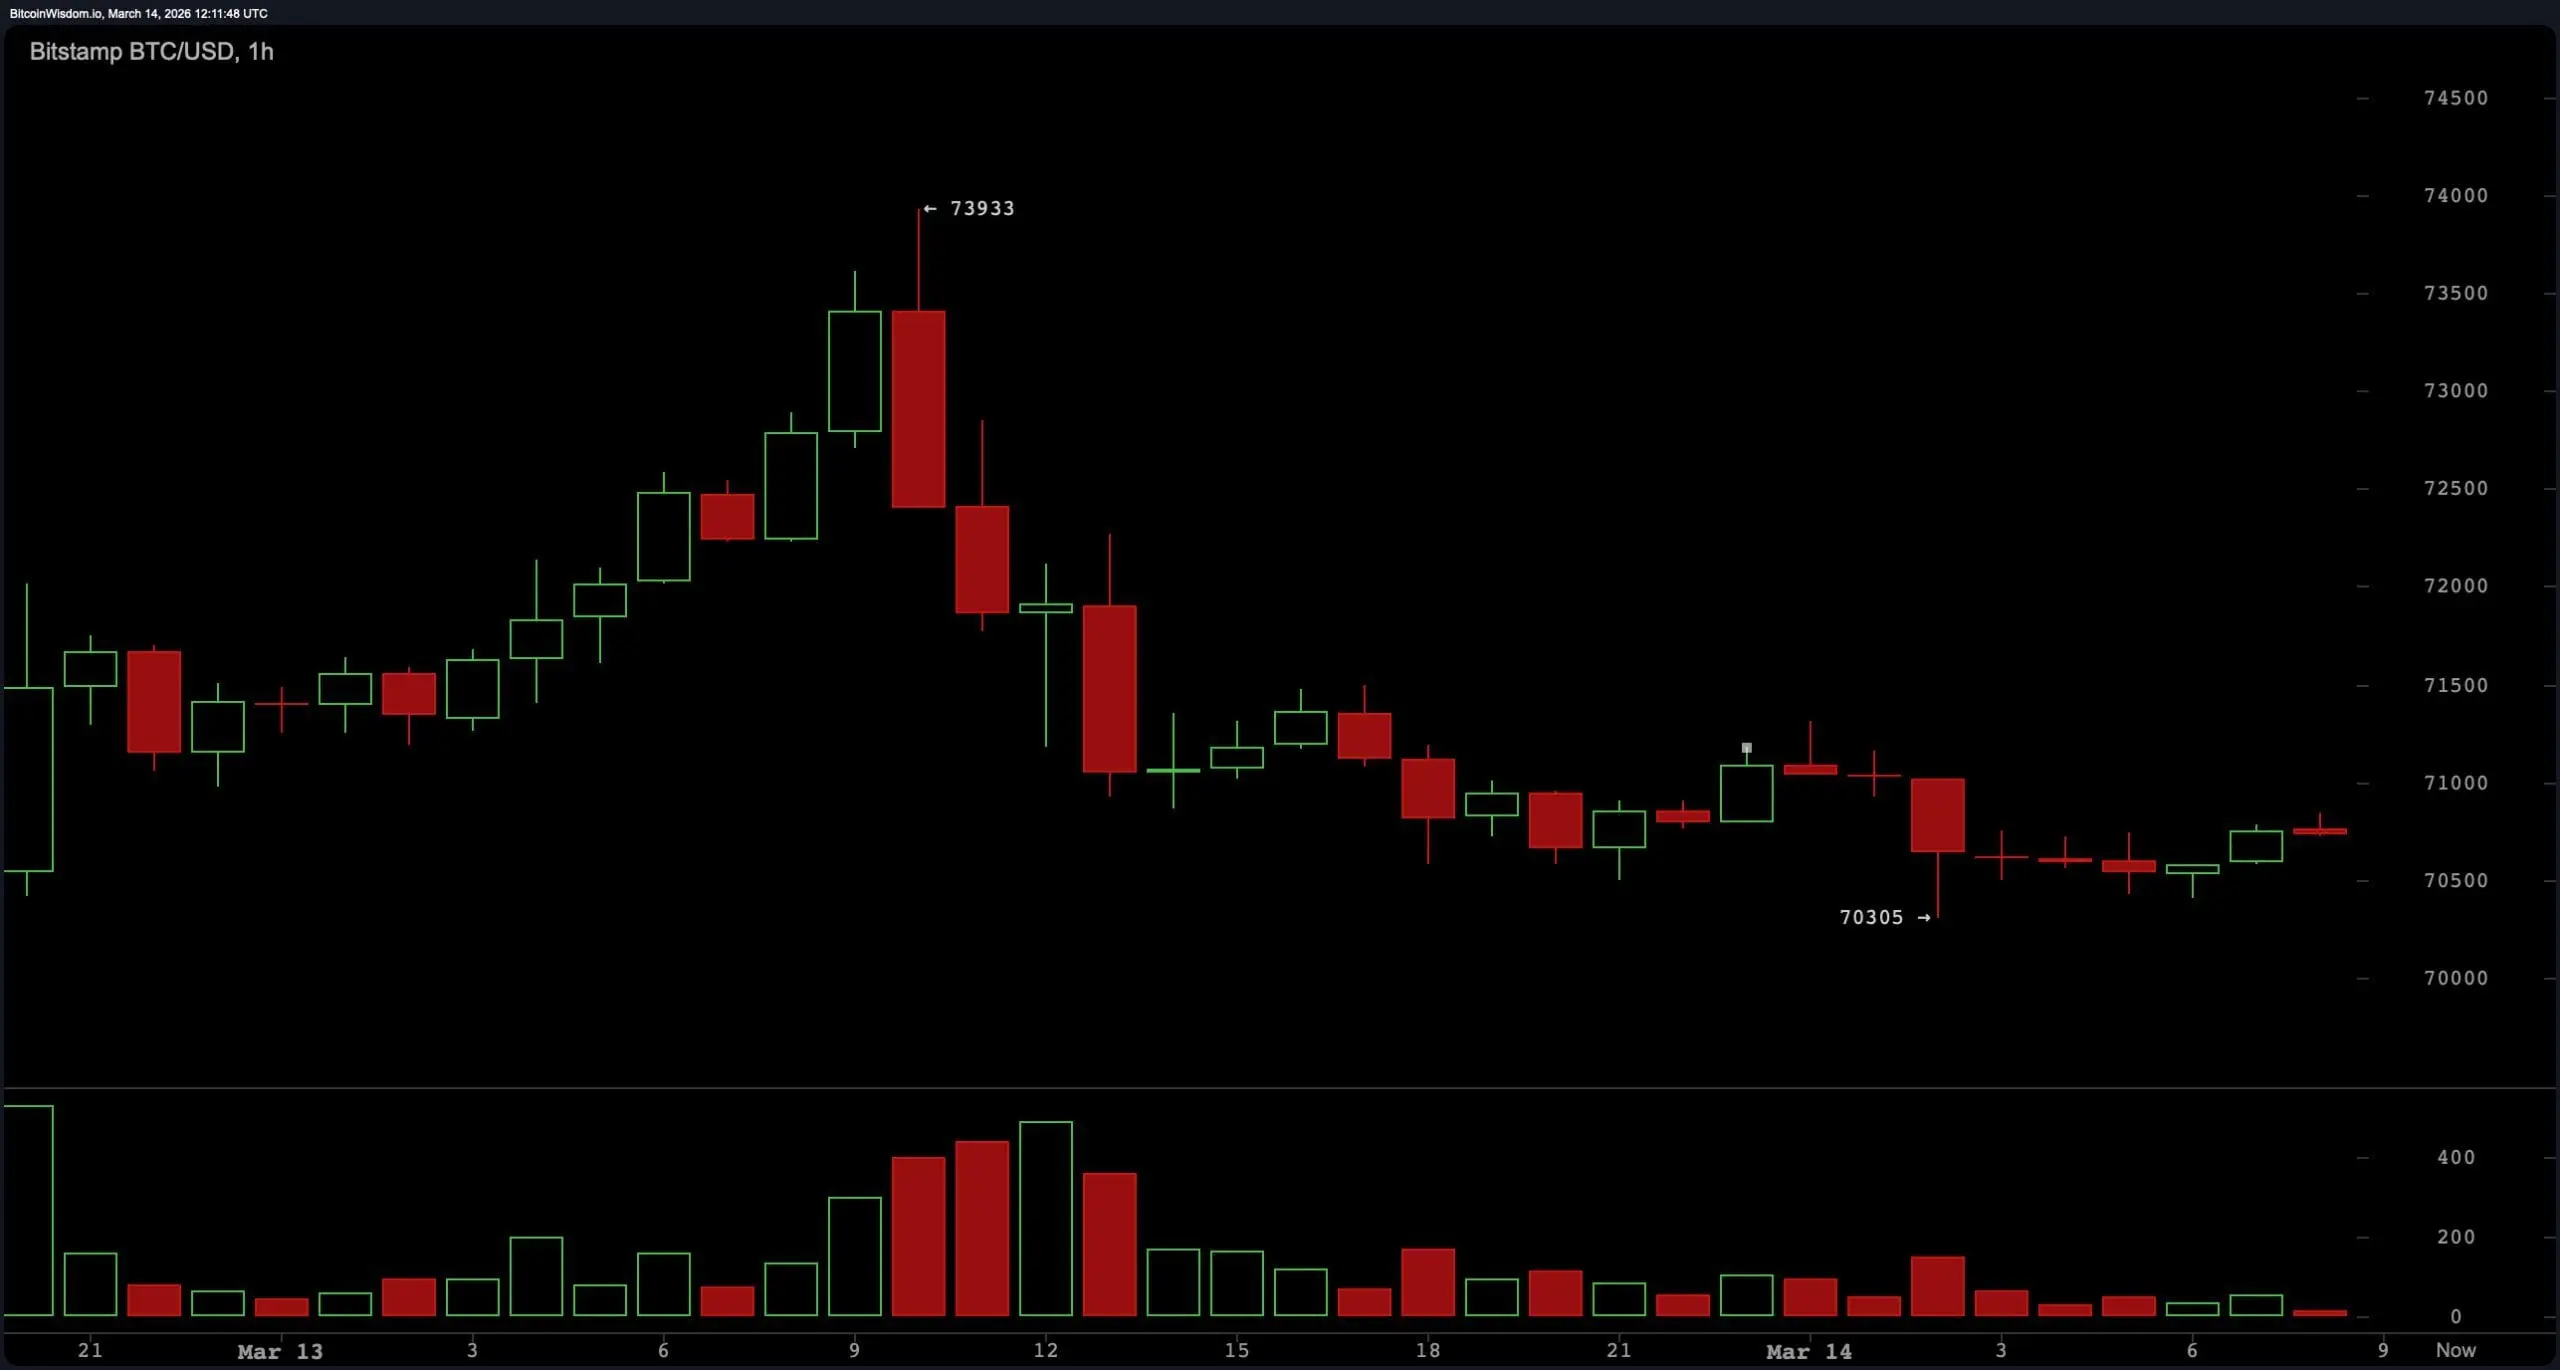 BTC/USD 1-hour chart via Bitstamp on March 14, 2026.
Oscillator readings reflect a neutral technical environment. The relative strength index ( RSI) is positioned at 53, indicating balanced momentum conditions. Stochastic reads 68, while the commodity channel index (CCI) is measured at 89, both also categorized as neutral signals.
BTC/USD 1-hour chart via Bitstamp on March 14, 2026.
Oscillator readings reflect a neutral technical environment. The relative strength index ( RSI) is positioned at 53, indicating balanced momentum conditions. Stochastic reads 68, while the commodity channel index (CCI) is measured at 89, both also categorized as neutral signals.
The average directional index (ADX) stands at 25, showing limited trend strength across the market. The Awesome oscillator records 2,432 and remains neutral. Momentum shows −1,891, signaling short-term downward pressure, while the moving average convergence divergence ( MACD) level registers −186 and signals upward momentum in the indicator summary.
Moving averages (MAs) present a split structure between short-term support and longer-term resistance levels. The exponential moving average (EMA) 10 sits at $69,648 and the simple moving average (SMA) 10 at $69,310, both signaling upward momentum relative to the current price. The EMA 20 at $69,305 and SMA 20 at $68,287 also remain supportive of the current range, along with the EMA 30 at $70,053 and SMA 30 at $68,215.
Longer-term averages reflect downward pressure, with the EMA 50 at $72,764 and the SMA 50 at $71,703 positioned above the price. Higher-period averages remain significantly elevated, including the EMA 100 at $79,665, SMA 100 at $80,935, EMA 200 at $87,978, and SMA 200 at $94,125. This distribution results in an overall neutral technical summary as short-term averages support current levels while longer-term averages remain above the market.
Bull Verdict:
If bitcoin maintains support above $69,500 and breaks decisively above the $71,200 resistance level, the current compression pattern could resolve to the upside. A sustained move through this level would clear short-term resistance and open the path toward $72,800 and a potential retest of the $73,800–$74,000 resistance zone seen on the daily chart. The sequence of higher lows on the four-hour timeframe and supportive short-term moving averages suggests underlying strength remains intact as long as price holds above the mid-range support area.
Bear Verdict:
A breakdown below the $69,500 support level would weaken the current consolidation structure and shift short-term momentum downward. Losing this level would place bitcoin below key range support and expose lower targets around $67,800, with a deeper support zone near $66,000 visible on the daily timeframe. Longer-term moving averages remaining above current price levels continue to signal overhead resistance, meaning sustained weakness below support could accelerate downside pressure if bearish momentum increases.
FAQ 🧭
- What is the bitcoin price on March 14, 2026?
Bitcoin is trading around $70,795, consolidating near the $70,000 level after rejecting resistance near $74,000.
- What are the key bitcoin resistance levels right now?
The main resistance levels for bitcoin are $71,200 in the short term and the major resistance zone between $73,800 and $74,000.
- What are the key bitcoin support levels to watch?
Key bitcoin support sits near $70,300 intraday, with stronger structural support at $69,500 and major support near $66,000.
- Is bitcoin trending up or down right now?
Bitcoin’s current technical trend is neutral as indicators and moving averages show consolidation between roughly $69,500 and $72,000.
Related Articles
Caltech Research Shows Quantum Bitcoin Threat Could Arrive with 10,000 Qubits
A team from Caltech and startup Oratomic published research on March 31, 2026 demonstrating that a fault-tolerant quantum computer capable of running Shor’s algorithm could be built with as few as 10,000 physical qubits, dramatically reducing previous estimates that placed the requirement at one million qubits or higher.
GateNews12m ago
Empery Digital reduced its holdings by 79 BTC last week, bringing its position down to 3,359 BTC
Gate News reports that on April 1, Nasdaq-listed Bitcoin treasury company Empery Digital disclosed that it sold 79 bitcoins last week at an average price of $71,031, generating total proceeds of approximately $5.6 million. Its total bitcoin holdings have decreased to 3,359 bitcoins. Additionally, the company revealed that to date, it has invested about $137 million to repurchase 23,630,147 shares of common stock. Going forward, it will continue to sell bitcoin as needed to fund future stock buybacks and may also repay some outstanding debt.
GateNews41m ago
A certain CEX still has 4,619 BTC in outstanding borrowings owed to the related party Winklevoss Capital
On April 1, Arkham analyst Emmett Gallic disclosed that a cryptocurrency exchange has not yet repaid a BTC loan of 4,619 BTC, worth approximately $314 million, with an annual fee rate of 4%-8%, no fixed maturity date, and lenders able to demand repayment at any time. Historically, the exchange has borrowed more than 11,000 BTC and 133,000 ETH.
GateNews50m ago
BTC 15-minute modest uptrend of 0.49%: institutional fund flows are driving short-term price anomalies
2026-04-01 03:00 to 2026-04-01 03:15 (UTC), BTC fluctuated in the 67,663.9 to 68,103.8 USDT range. The candlestick return rate recorded +0.49%, with an amplitude of 0.65%. During this period, market attention warmed up, with on-chain activity and trading volume increasing in tandem. Heightened short-term capital inflows and outflows triggered mild price fluctuations, and traders’ sentiment turned more cautious.
The main driving force behind this unusual move was dominated by institutional fund flows, including whales and institutions making large transfers to exchanges and withdrawals within 10 minutes; meanwhile, whales also transferred large amounts to the exchange and moved funds out to other addresses, indicating active capital repositioning during this period.
GateNews57m ago
Did the Bitcoin quantum threat arrive early? Google simulates a 9-minute hijacking of funds—6.9 million BTC could be in danger
Google research shows that the number of qubits required to break Bitcoin could be lower than 500,000—far below expectations—which puts about 9.0 million BTC at potential risk. Quantum computers can intercept transactions within “9 minutes,” and especially after the Taproot upgrade, many wallets are exposed to attack risk. This serves as a reminder that the crypto industry needs to guard against quantum threats as soon as possible.
CryptoCity59m ago
