#黄金 #Spot Gold
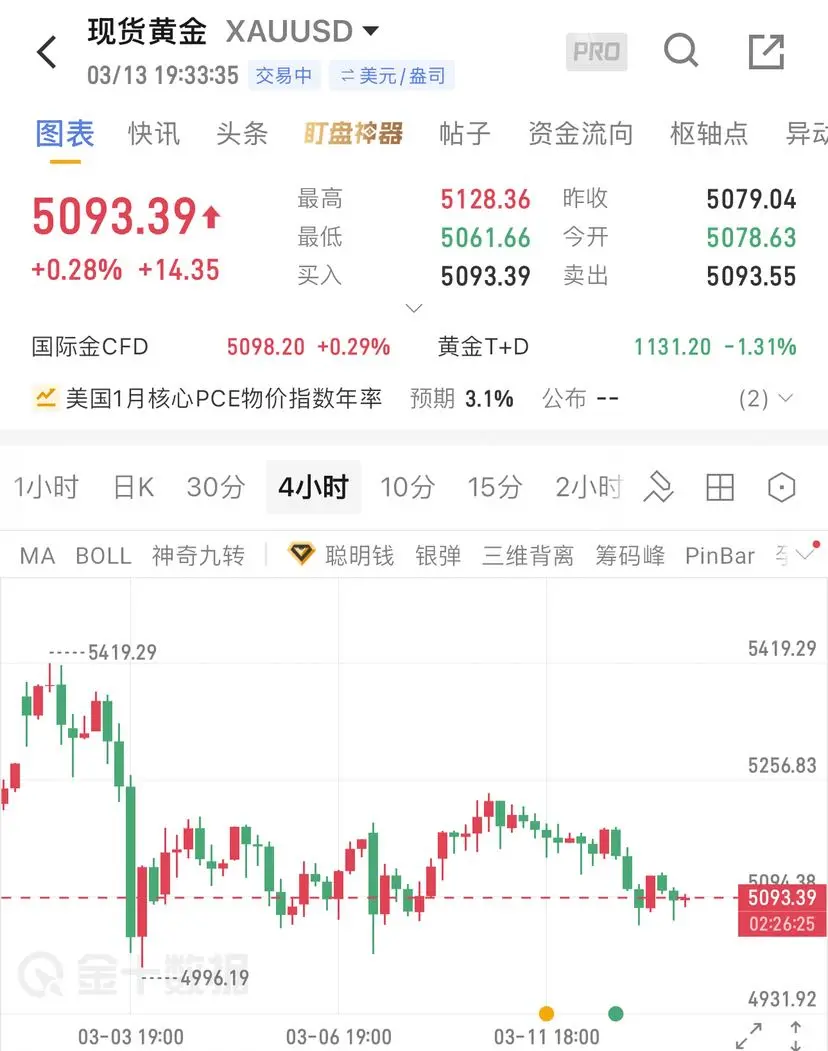
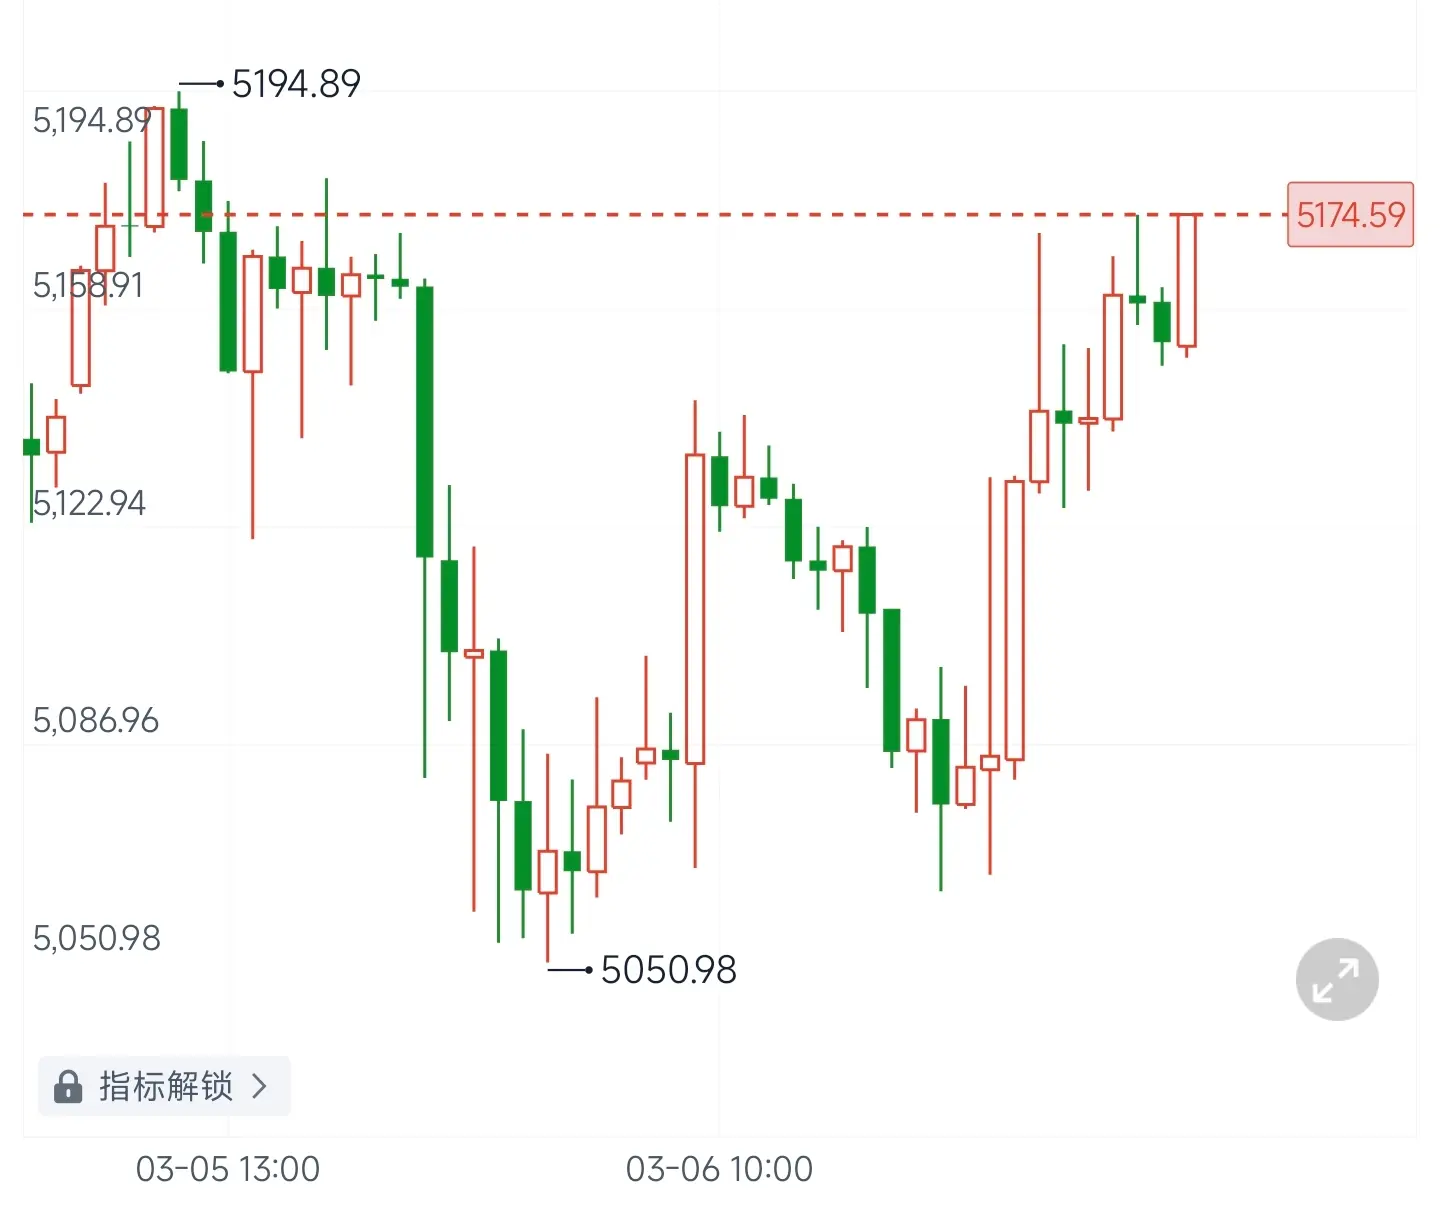
March 6 Gold Analysis: Spot gold once again experienced a significant decline yesterday, with prices dropping from a high of 5194 down to 5050, a single-day fall of 144 points. This follows the sharp decline on March 3, and the gold price has once again shown a clear unilateral downward trend.
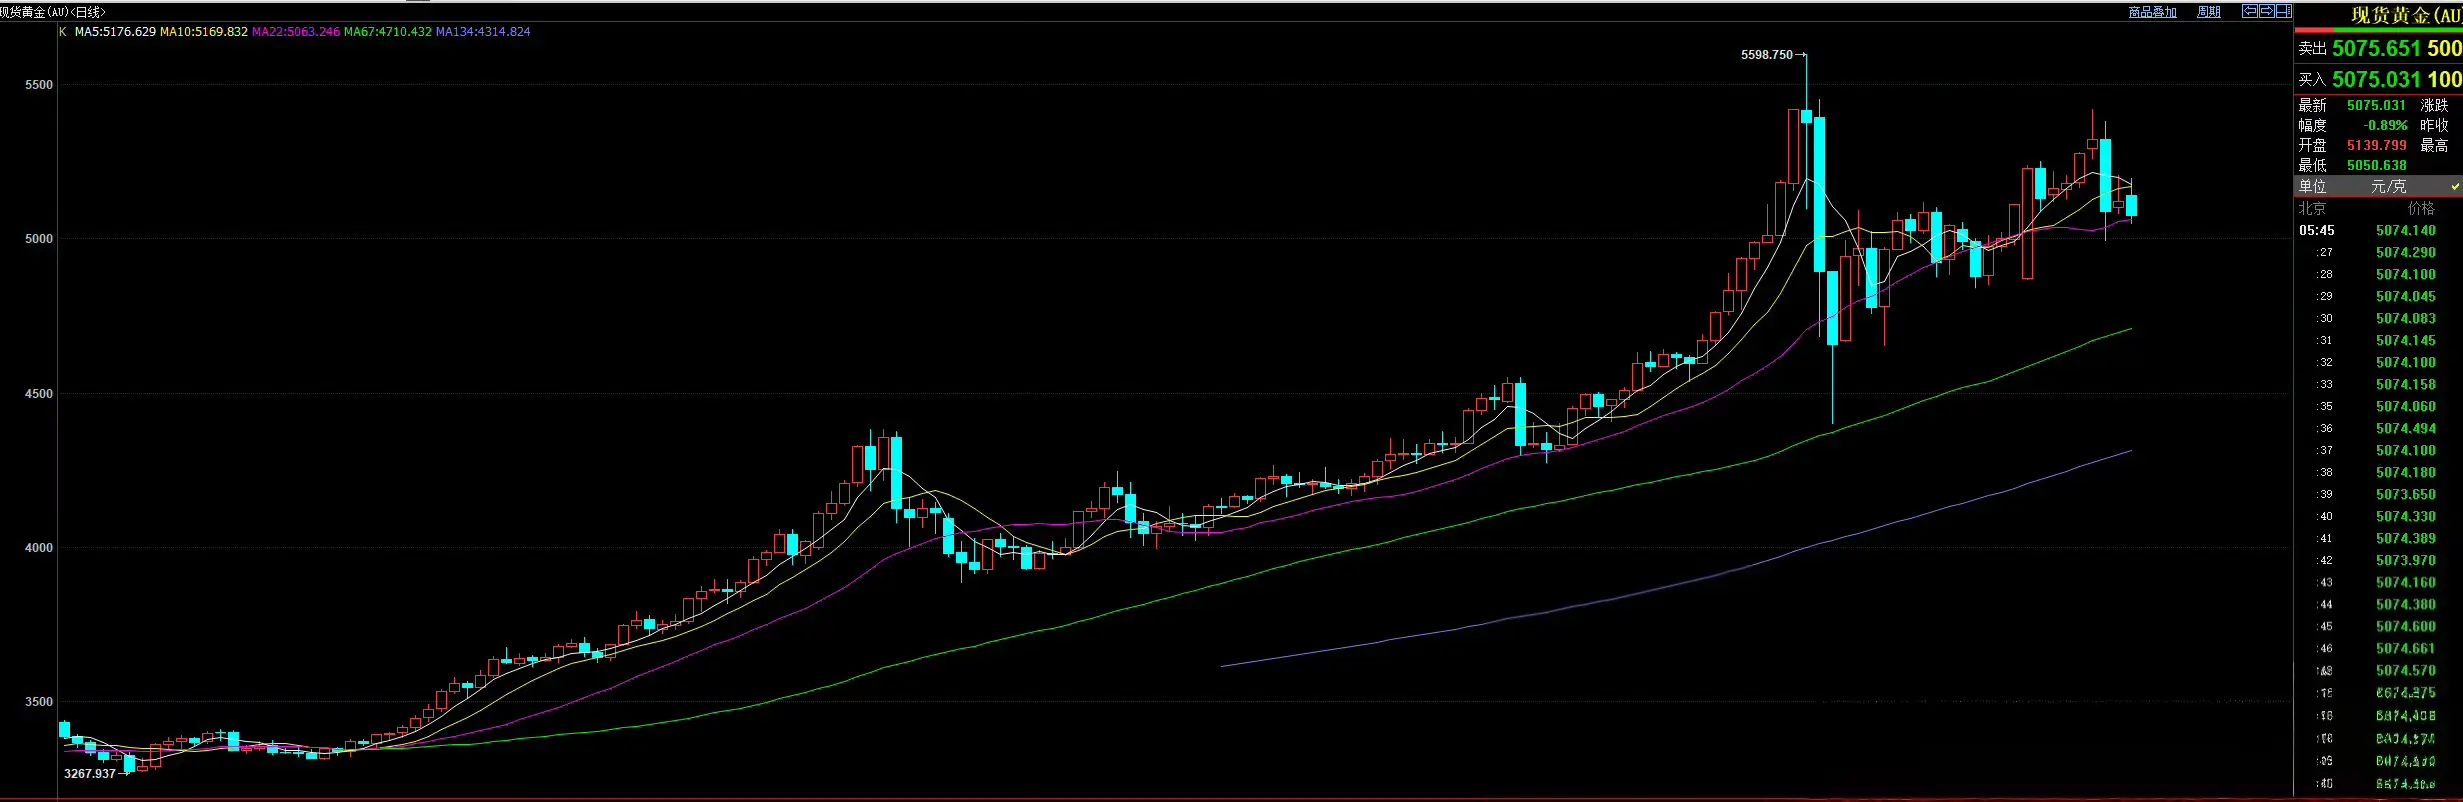
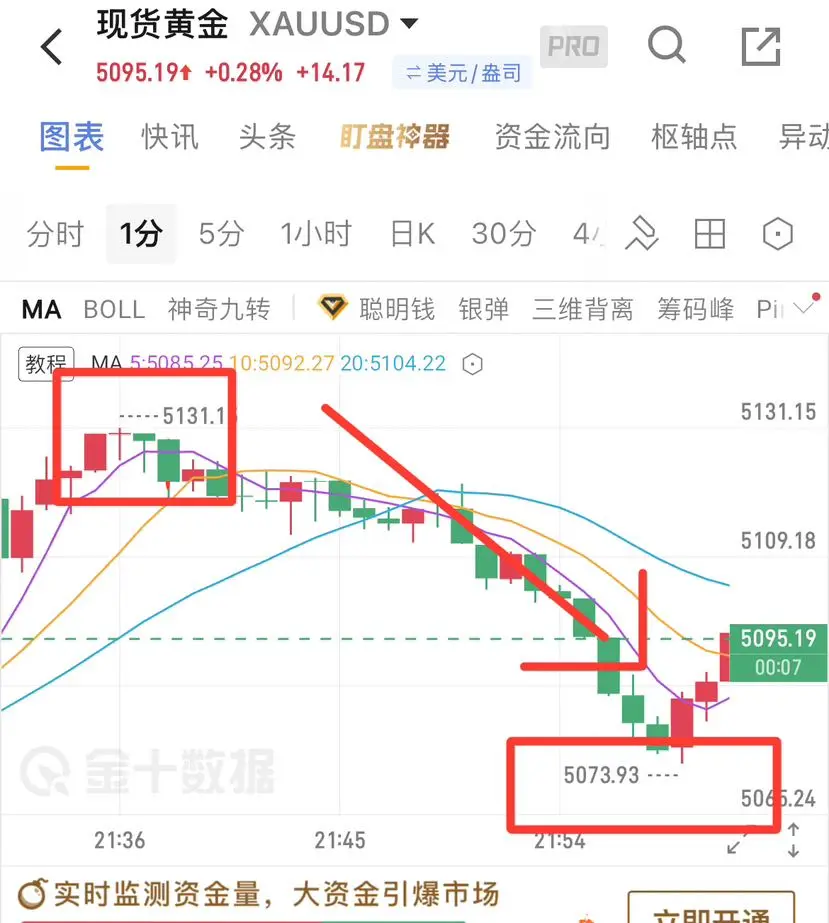
From the daily chart perspective, the gold price has now tested the 22-day moving average support for the third time. After multiple attempts, the probability of a short-term breakdown and downward movement continues to increase.
Next, focus on the key support at the $5000 level. Once