
【War Reversal + Big Bullish Candle: Is BTC About to Break 82,000?】
The world is a huge makeshift operation. This war between the U.S. and Iran once again proves it. The day before, it was a relentless standoff—then the next moment, Trump announced a temporary pause on military strikes against Iran, and Iran agreed to reopen the Strait of Hormuz. This is enough to make people’s brains feel like they can’t quite process it—what are they playing at? What a farce! Political chess is as childish as ever, but the boost to the financial market is undeniably real. Hearing the news, global markets surged across the board, and BTC’s rally directly pulled out a big bullish candle. With external stimuli, the small trend has seen some reversal.
From a technical perspective, our previous expectation was to first dip to around 63,000, and then start this rebound. Since this rebound has arrived earlier than expected, let’s reorganize the analysis again.
First, let’s make the viewpoint clear: the end of the war does not mean the downtrend is completely over. On a larger timeframe, this month is the sixth month of the bear-market decline. Looking back at previous cycles, the duration of bear-market declines is generally in the range of 10 to 12 months, and there’s still far from enough time.
The current stage is at the tail end of the first leg of the sharp sell-off—the period where a rebound is being brewed. In terms of the wave structure, this is also where the rebound is not far off from the last rebound, and the subsequent final leg of selling pressure. Therefore, 60,000 is not the bottom—it’s a highly probable outcome event!
With that said, don’t panic. The big cycle only sets the tone—trend judgment and decisions on how to trade still need to be analyzed based on the medium- and short-term structure.
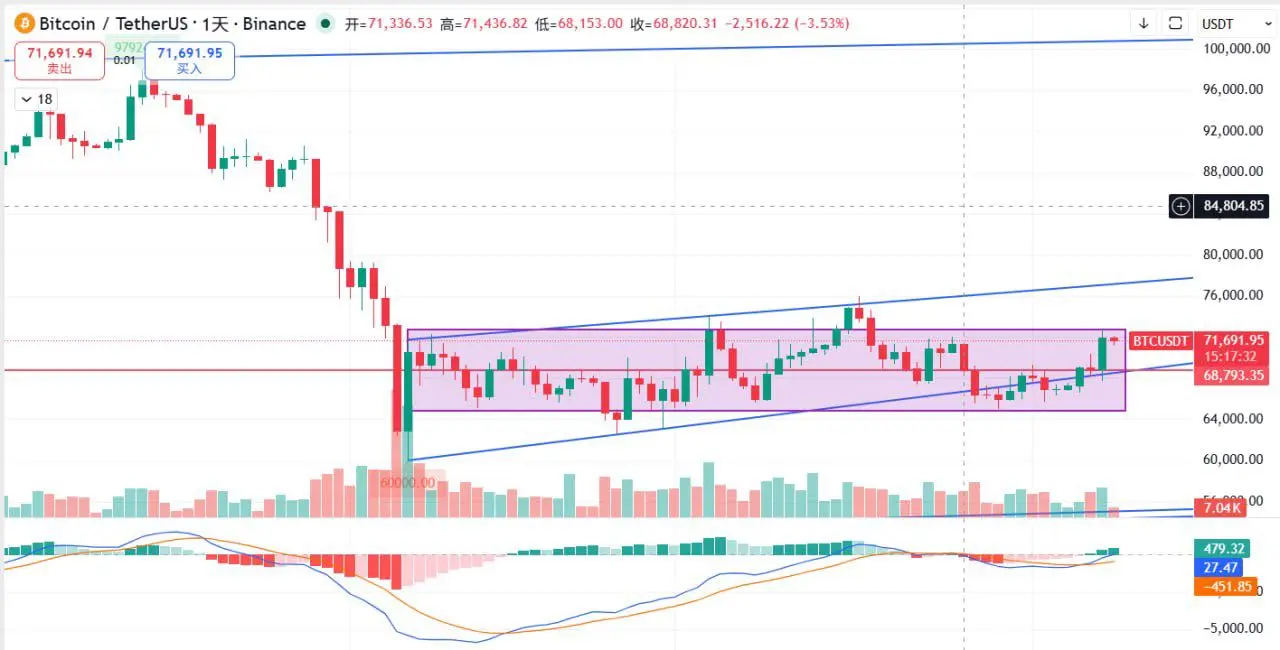
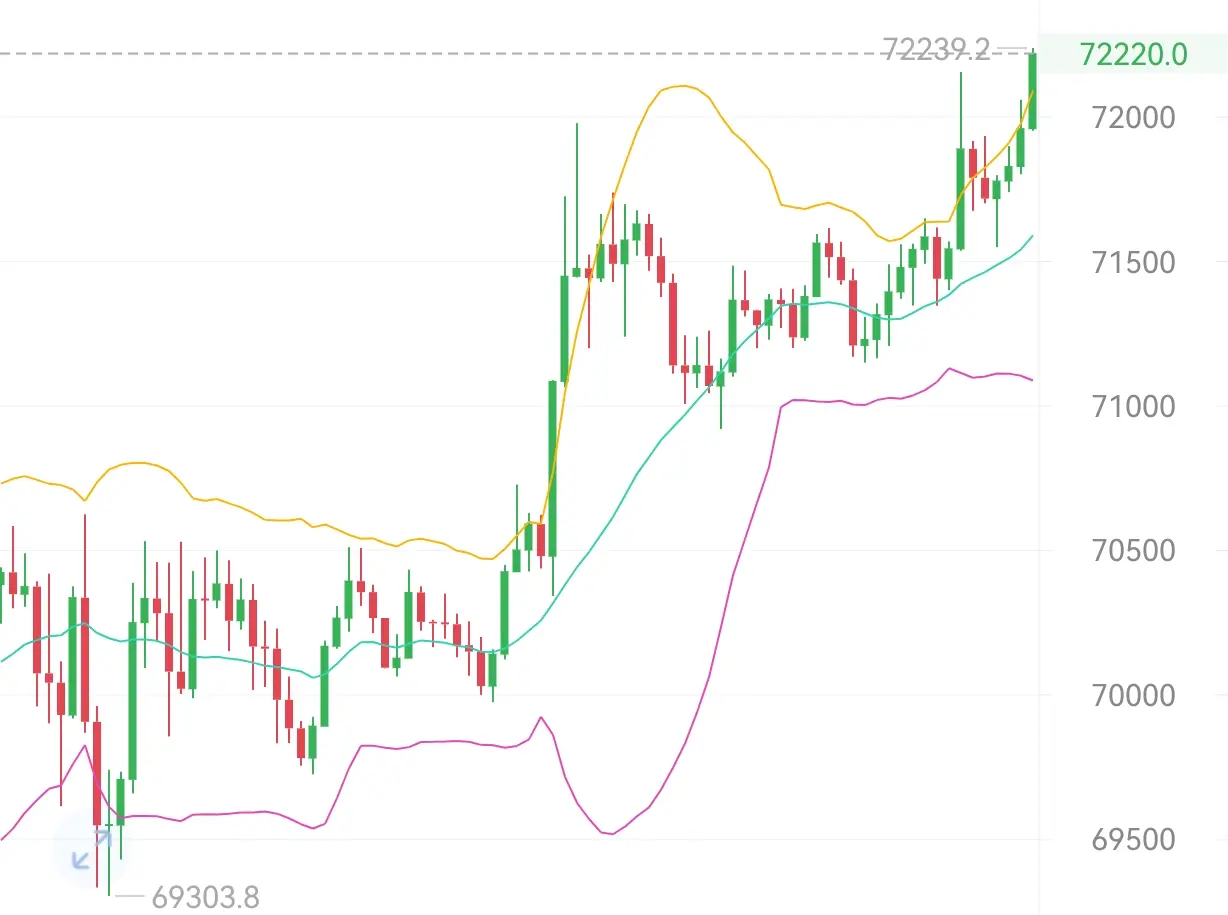
From the medium- and short-term structure, the rebound will continue. The weekly chart is about to form a golden cross while still below the waterline. On the daily chart, a mid-to-large bullish candle has been able to hold effectively back within the flag pattern. Even the moving average suppression has been broken—these all indicate that the rebound will keep going.
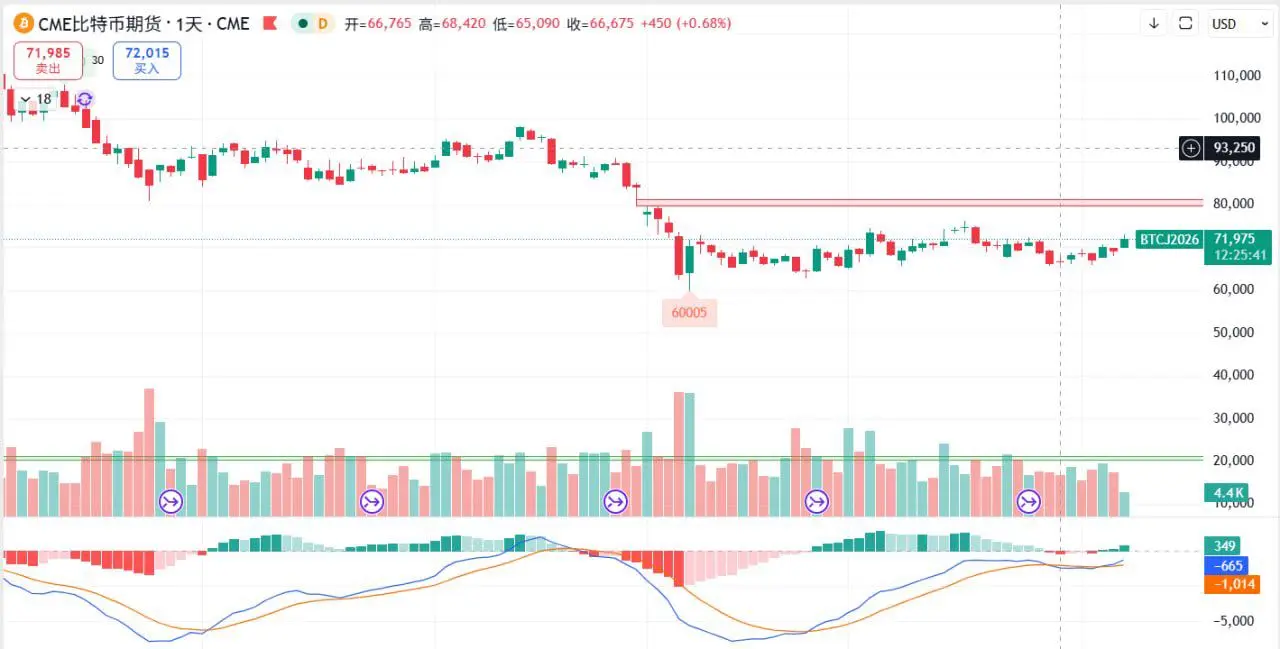
As for the next move, it’s expected to see some consolidation here. The reason is that it has hit the parallel resistance of the 72,000 small box upper boundary. After the consolidation, the upside is still expected to continue. First, put your focus on the flag’s upper boundary at 78,000. If it can break above it, then the CME gap near 82,000 mentioned multiple times earlier is highly likely to be reached!
In terms of trading: because we saw a high followed by a pullback, a four-hour divergence forming pattern has appeared. The market has a need for consolidation and a pullback. Support is around 698,000—feel free to pay close attention to opportunities to participate around here!
#美国伊朗同意停火两周 $BTC #加密市场反弹 $ETH #BTC走势分析
The world is a huge makeshift operation. This war between the U.S. and Iran once again proves it. The day before, it was a relentless standoff—then the next moment, Trump announced a temporary pause on military strikes against Iran, and Iran agreed to reopen the Strait of Hormuz. This is enough to make people’s brains feel like they can’t quite process it—what are they playing at? What a farce! Political chess is as childish as ever, but the boost to the financial market is undeniably real. Hearing the news, global markets surged across the board, and BTC’s rally directly pulled out a big bullish candle. With external stimuli, the small trend has seen some reversal.
From a technical perspective, our previous expectation was to first dip to around 63,000, and then start this rebound. Since this rebound has arrived earlier than expected, let’s reorganize the analysis again.
First, let’s make the viewpoint clear: the end of the war does not mean the downtrend is completely over. On a larger timeframe, this month is the sixth month of the bear-market decline. Looking back at previous cycles, the duration of bear-market declines is generally in the range of 10 to 12 months, and there’s still far from enough time.
The current stage is at the tail end of the first leg of the sharp sell-off—the period where a rebound is being brewed. In terms of the wave structure, this is also where the rebound is not far off from the last rebound, and the subsequent final leg of selling pressure. Therefore, 60,000 is not the bottom—it’s a highly probable outcome event!
With that said, don’t panic. The big cycle only sets the tone—trend judgment and decisions on how to trade still need to be analyzed based on the medium- and short-term structure.
From the medium- and short-term structure, the rebound will continue. The weekly chart is about to form a golden cross while still below the waterline. On the daily chart, a mid-to-large bullish candle has been able to hold effectively back within the flag pattern. Even the moving average suppression has been broken—these all indicate that the rebound will keep going.
As for the next move, it’s expected to see some consolidation here. The reason is that it has hit the parallel resistance of the 72,000 small box upper boundary. After the consolidation, the upside is still expected to continue. First, put your focus on the flag’s upper boundary at 78,000. If it can break above it, then the CME gap near 82,000 mentioned multiple times earlier is highly likely to be reached!
In terms of trading: because we saw a high followed by a pullback, a four-hour divergence forming pattern has appeared. The market has a need for consolidation and a pullback. Support is around 698,000—feel free to pay close attention to opportunities to participate around here!
#美国伊朗同意停火两周 $BTC #加密市场反弹 $ETH #BTC走势分析