#TopCoinsRisingAgainsttheTrend
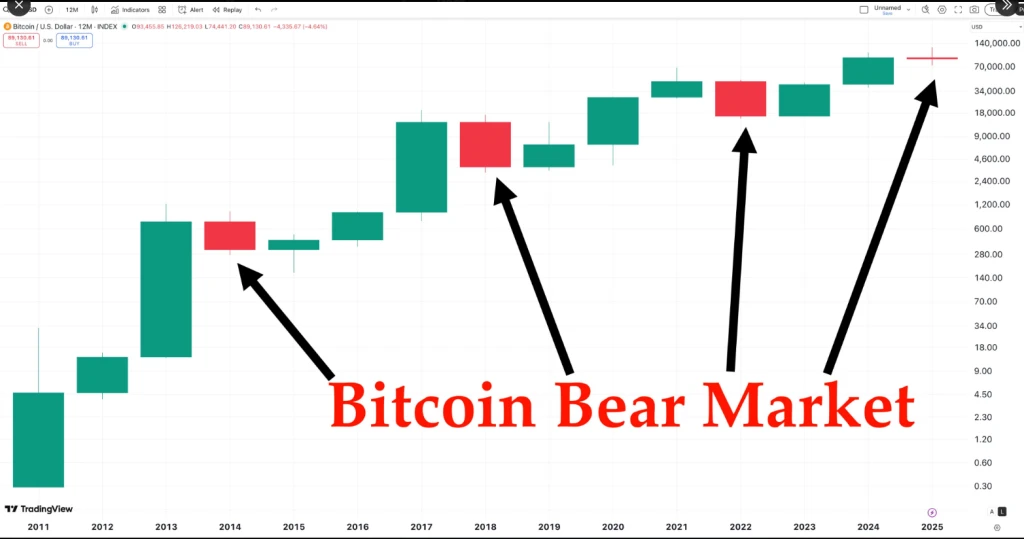
The crypto market is mostly down in early 2026. Bitcoin (BTC) has fallen sharply from late-2025 highs (~$126K) to around $60K–$73K, and most altcoins have dropped with it. The overall trend is bearish, with high liquidations and ETF outflows.
But some coins are rising against the trend — performing well even while BTC and most altcoins fall. This usually happens when coins have real utility, strong narratives, or low correlation to BTC.
Why Some Coins Rise
Decoupled from BTC: Prices move independently of Bitcoin.
Strong narratives or real utility: DEXs, DeFi platforms, privacy coins, and infrastructure tokens.
Recent catalysts: Upgrades, adoption spikes, or sector rotation.
Momentum: Smaller/mid-cap coins often gain in volatile markets.
Traits of Coins Rising Against the Trend
Usually mid or small-cap with real use cases (DEXs, payments, infra).
Gain 10–30%+ while BTC drops.
Hold support levels well in bear markets.
Can outperform if BTC stabilizes or macro conditions improve.
Risks: High volatility, speculative moves, bear market can erase gains. Always do your own research.
Two Examples (as of Feb 7, 2026)
1️⃣ Hyperliquid (HYPE)
Price: ~$30–$40
Up 28–34% in past month/7 days while BTC fell ~24%
Why rising: Leading decentralized perpetuals/DEX platform with high volume and revenue. Low BTC correlation. Thrives in volatile markets.
Potential: Could 2–5x if alt rotation continues, strong short-term performer.
2️⃣ XRP (Ripple)
Price: ~$1.45–$1.60
Up 16–20% in recent rallies, outpacing BTC/ETH
Why rising: Strong payments network, institutional adoption, regulatory clarity hopes. Less correlated to risk-on moves.
Potential: Could lead alt recovery, solid hedge in a downtrend, long-term upside if adoption grows.
Bottom Line
Even in this early-2026 bear market, few coins rise. Focus on:
Utility-driven, decoupled plays (like HYPE)
Resilient majors (like XRP)
Watch BTC around $70K+ — stability there could spark broader altcoin recovery.
Summary: Selective coins are performing well despite the bear trend. Look for real utility, low correlation, and strong narratives to find these opportunities.