Trade
Trading Type
Spot
Trade crypto freely
Alpha
Points
Get promising tokens in streamlined on-chain trading
Pre-Market
Trade new tokens before they are officially listed
Margin
Magnify your profit with leverage
Convert & Block Trading
0 Fees
Trade any size with no fees and no slippage
Leveraged Tokens
Get exposure to leveraged positions simply
Futures
Futures
Hundreds of contracts settled in USDT or BTC
Options
HOT
Trade European-style vanilla options
Unified Account
Maximize your capital efficiency
Demo Trading
Futures Kickoff
Get prepared for your futures trading
Futures Events
Participate in events to win generous rewards
Demo Trading
Use virtual funds to experience risk-free trading
Earn
Launch
CandyDrop
Collect candies to earn airdrops
Launchpool
Quick staking, earn potential new tokens
HODLer Airdrop
Hold GT and get massive airdrops for free
Launchpad
Be early to the next big token project
Alpha Points
NEW
Trade on-chain assets and enjoy airdrop rewards!
Futures Points
NEW
Earn futures points and claim airdrop rewards
Investment
Simple Earn
Earn interests with idle tokens
Auto-Invest
Auto-invest on a regular basis
Dual Investment
Buy low and sell high to take profits from price fluctuations
Soft Staking
Earn rewards with flexible staking
Crypto Loan
0 Fees
Pledge one crypto to borrow another
Lending Center
One-stop lending hub
VIP Wealth Hub
Customized wealth management empowers your assets growth
Private Wealth Management
Customized asset management to grow your digital assets
Quant Fund
Top asset management team helps you profit without hassle
Staking
Stake cryptos to earn in PoS products
BTC Staking
HOT
Stake BTC and earn 10% APR
GUSD Minting
Use USDT/USDC to mint GUSD for treasury-level yields
More
北辰DZHTHWD
No content yet
北辰DZHTHWD
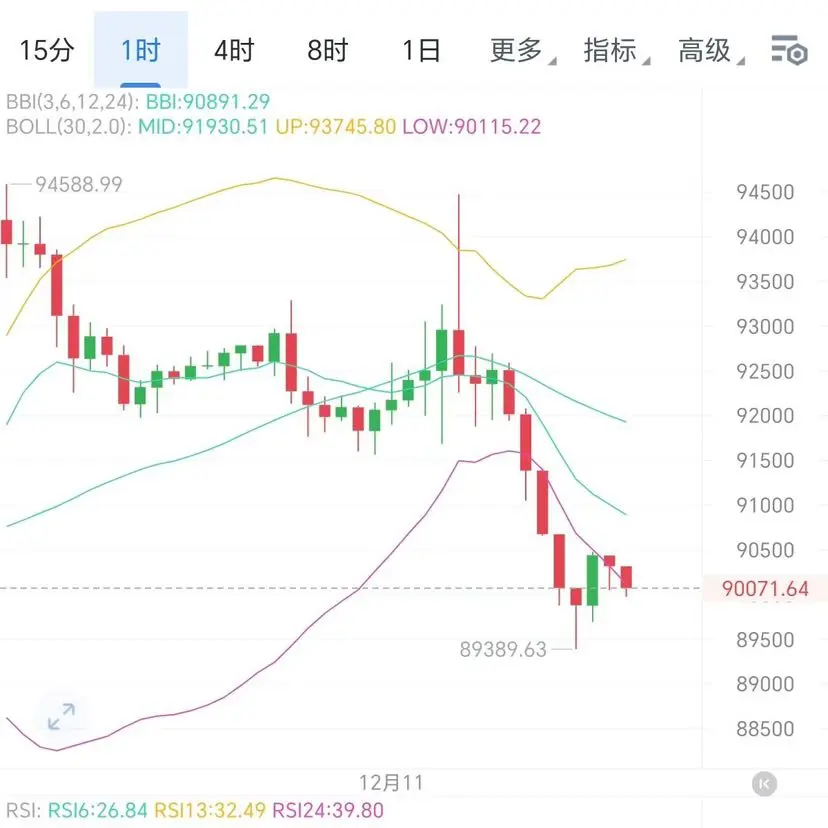
Today’s Bitcoin technical analysis conclusion: It is in a critical consolidation and decision-making period. The bulls' lifeline focuses on the 88,000-89,000 support zone. The upward momentum is insufficient, and there is a need to watch out for the risk of a breakdown.
Core Technical Indicators Breakdown
Trend Indicators (EMA/Bollinger Bands): The daily K-line has lost the EMA15 level (91,000). The upper band of the Bollinger Bands has compressed to 94,200. After retesting the middle band (89,900), the price has shown weak consolidation; the 4-hour Bollinger Bands have narrowed to 88,800-93,7
BTC2%

- Reward
- 1
- Comment
- Repost
- Share
Market Analysis
Last night, the script played out again: the Federal Reserve announced a rate cut, Powell’s speech was dovish, the market initially celebrated and surged higher, then a large bearish candle slammed down, trapping all the late buyers. What does this indicate? It shows that the current market is extremely fragile; any positive news that pushes prices up is just a “trap to lure more longs,” providing a better entry point for the bears to dump.
This is the third rate cut this year, and the market has become numb; technical indicators all point to “bearish.” Daily candles have been
View OriginalLast night, the script played out again: the Federal Reserve announced a rate cut, Powell’s speech was dovish, the market initially celebrated and surged higher, then a large bearish candle slammed down, trapping all the late buyers. What does this indicate? It shows that the current market is extremely fragile; any positive news that pushes prices up is just a “trap to lure more longs,” providing a better entry point for the bears to dump.
This is the third rate cut this year, and the market has become numb; technical indicators all point to “bearish.” Daily candles have been
- Reward
- 2
- 4
- Repost
- Share
GateUser-9af343aa:
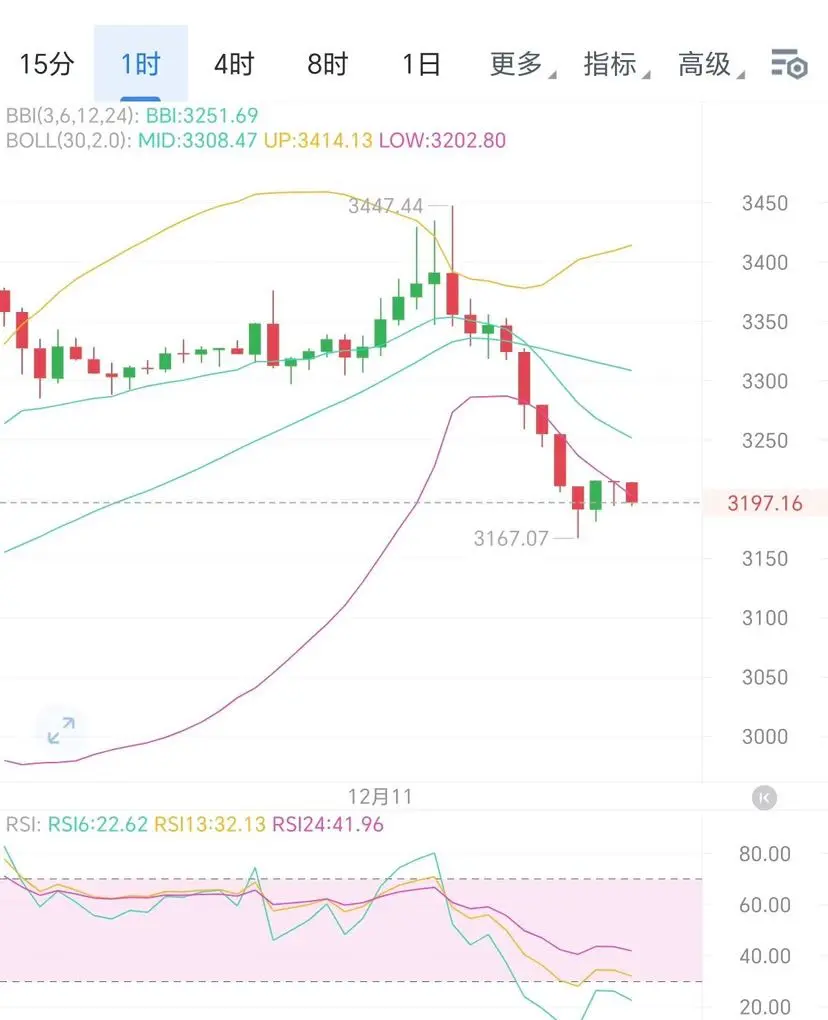
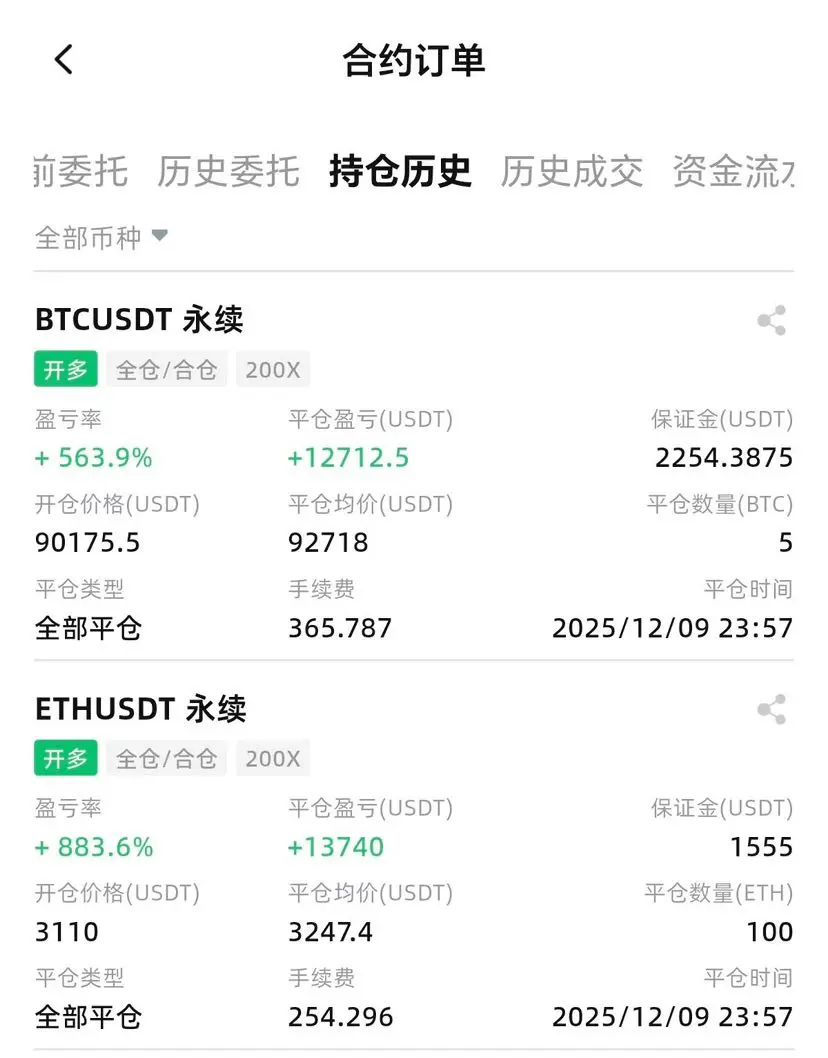
Real-time strategy: Sell in batches between 3276-3306, target 3180, stop-loss above 3318View More
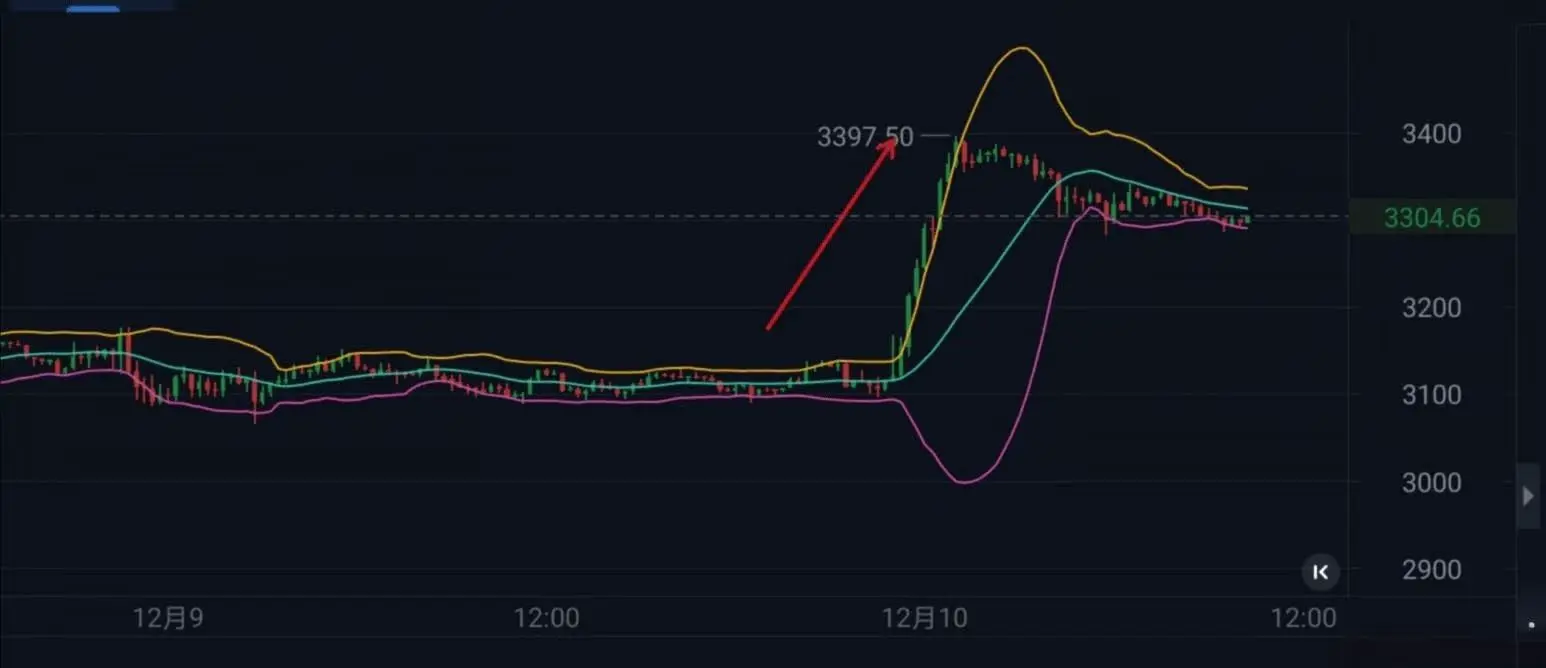
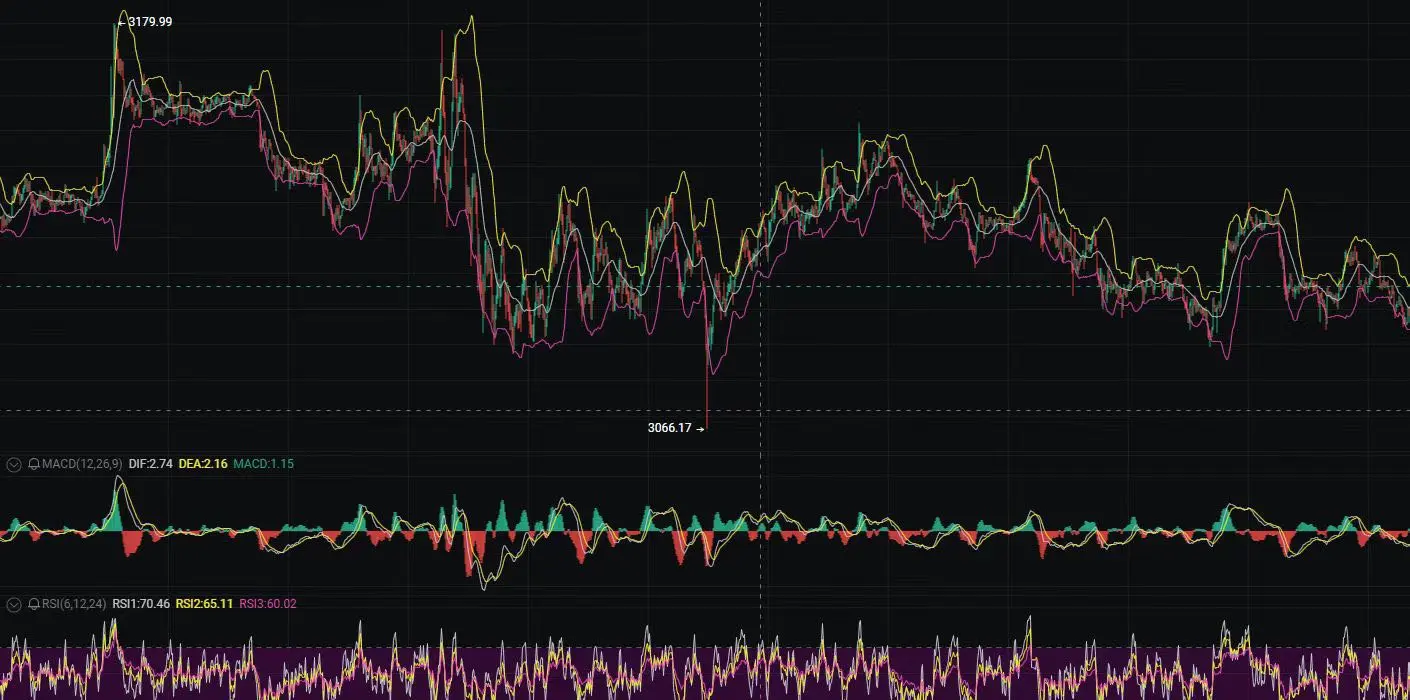
Yesterday evening, ETH surged sharply from 3100 to 3400, skyrocketing by 300 points and catching people off guard. Afterwards, the price consolidated and is now fluctuating around 3300.
From a technical standpoint, on the 4-hour chart, the price pulled back to the moving average and found key support. If the price holds steady, you can chase longs. The Bollinger Bands are expanding upward in all three tracks, indicating that bullish sentiment is recovering. The MACD indicator is above the zero axis and turning upward, with volume bars continuously increasing. You can buy on pullbacks during th
From a technical standpoint, on the 4-hour chart, the price pulled back to the moving average and found key support. If the price holds steady, you can chase longs. The Bollinger Bands are expanding upward in all three tracks, indicating that bullish sentiment is recovering. The MACD indicator is above the zero axis and turning upward, with volume bars continuously increasing. You can buy on pullbacks during th
ETH1%
- Reward
- like
- Comment
- Repost
- Share
The long position strategy given this afternoon has perfectly closed in profit, so you can sleep soundly now.
If you have no ideas, feel free to follow—an eight-year crypto veteran will help you break through.
View OriginalIf you have no ideas, feel free to follow—an eight-year crypto veteran will help you break through.
- Reward
- like
- Comment
- Repost
- Share
12.9 Market Analysis: BTC & ETH
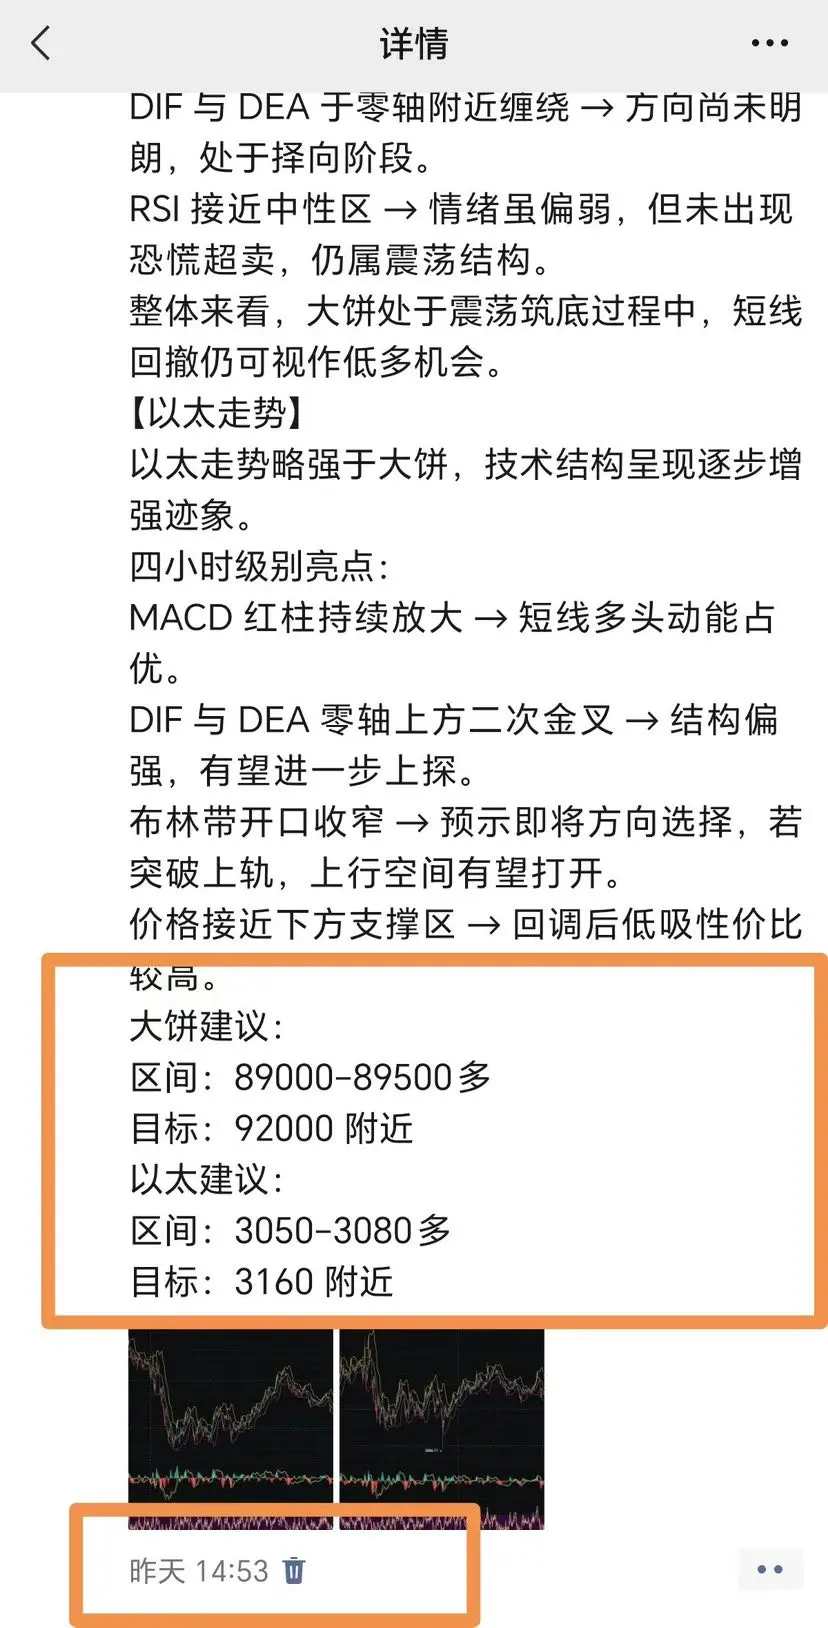
The overall market remains in a consolidation phase. BTC and ETH are repeatedly testing support levels in key ranges. There is slight divergence in the short-term trends, but the overall structure remains within a controllable range. Below is a multi-timeframe interpretation and trading reference.
【BTC Trend】
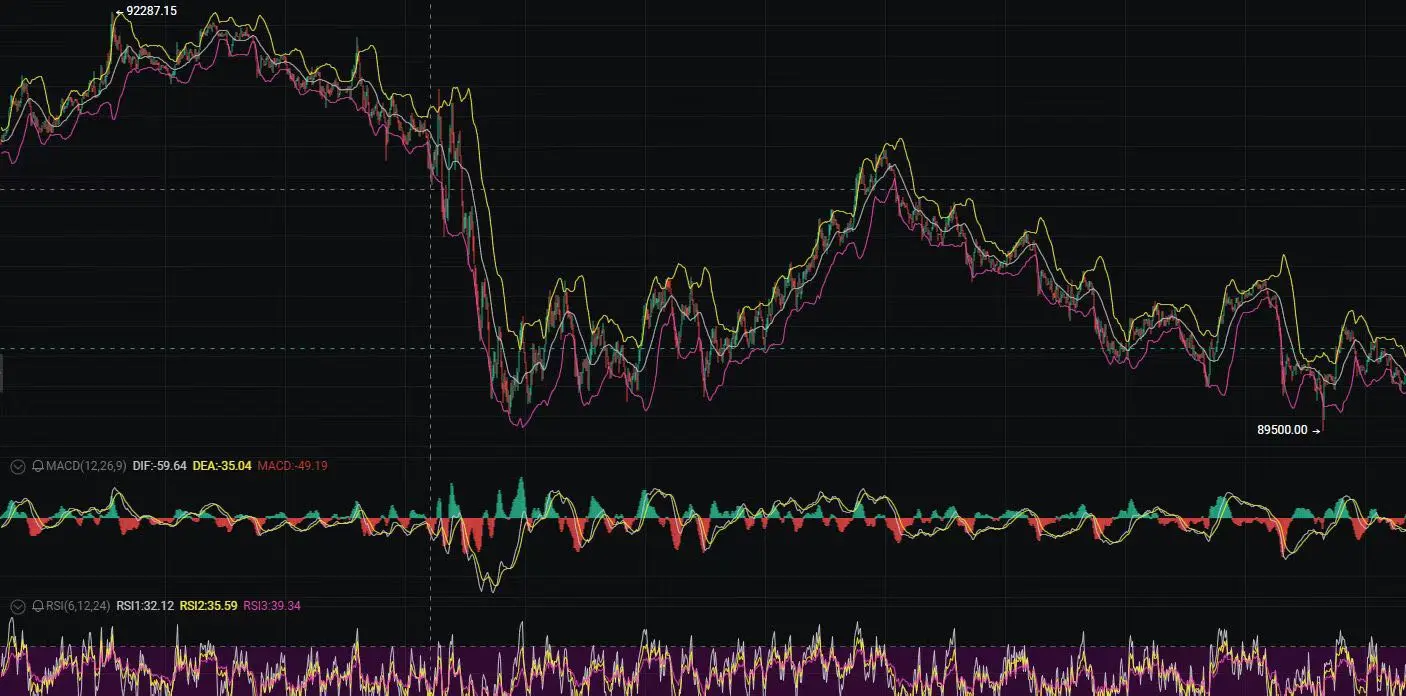
On the daily chart, BTC continues to consolidate around the 90,000 level, with intensified long-short battles.
4-hour technicals:
- MACD red bars are shortening → Bullish momentum is temporarily easing, and short-term price action is relatively weak
View OriginalThe overall market remains in a consolidation phase. BTC and ETH are repeatedly testing support levels in key ranges. There is slight divergence in the short-term trends, but the overall structure remains within a controllable range. Below is a multi-timeframe interpretation and trading reference.
【BTC Trend】
On the daily chart, BTC continues to consolidate around the 90,000 level, with intensified long-short battles.
4-hour technicals:
- MACD red bars are shortening → Bullish momentum is temporarily easing, and short-term price action is relatively weak
- Reward
- like
- Comment
- Repost
- Share
🔥Breaking: This week, the crypto market faces a decisive moment!
The next few days will directly determine the market trend for this month! Three major events, each of which could ignite the market 🔥
📅 December 9: JOLTs Job Openings Data Release
Forecast: 7.2 million, a key indicator for monitoring the labor market!
Below 7.2 million = Weak employment → Rate cut expectations rise → Positive for liquidity 🚀
Above 7.2 million = Strong employment → Rate cuts may be delayed → Market pressure 😰
🏛️ December 10: Fed Interest Rate Decision + Powell Speech
The market has already priced in a "25 b
View OriginalThe next few days will directly determine the market trend for this month! Three major events, each of which could ignite the market 🔥
📅 December 9: JOLTs Job Openings Data Release
Forecast: 7.2 million, a key indicator for monitoring the labor market!
Below 7.2 million = Weak employment → Rate cut expectations rise → Positive for liquidity 🚀
Above 7.2 million = Strong employment → Rate cuts may be delayed → Market pressure 😰
🏛️ December 10: Fed Interest Rate Decision + Powell Speech
The market has already priced in a "25 b

- Reward
- like
- Comment
- Repost
- Share

Bitcoin completed a long-short reversal in the early morning, surging over 4,000 points in a short period and successfully breaking through the psychological resistance at 90,000. Bullish sentiment is marginally recovering, breaking the previous weak consolidation pattern.
On the daily chart, a bullish candle was formed. After breaking above the midline resistance, the price continued upward but encountered resistance near 91,700 and pulled back to around 88,900. This area has concentrated selling pressure; subsequent rebounds testing this range are still expected to face pullbacks, so pay att
On the daily chart, a bullish candle was formed. After breaking above the midline resistance, the price continued upward but encountered resistance near 91,700 and pulled back to around 88,900. This area has concentrated selling pressure; subsequent rebounds testing this range are still expected to face pullbacks, so pay att
BTC2%

- Reward
- like
- Comment
- Repost
- Share