Mr.Chocolate
vip
Age 0.1 Yıl
Peak Tier 0
No content yet
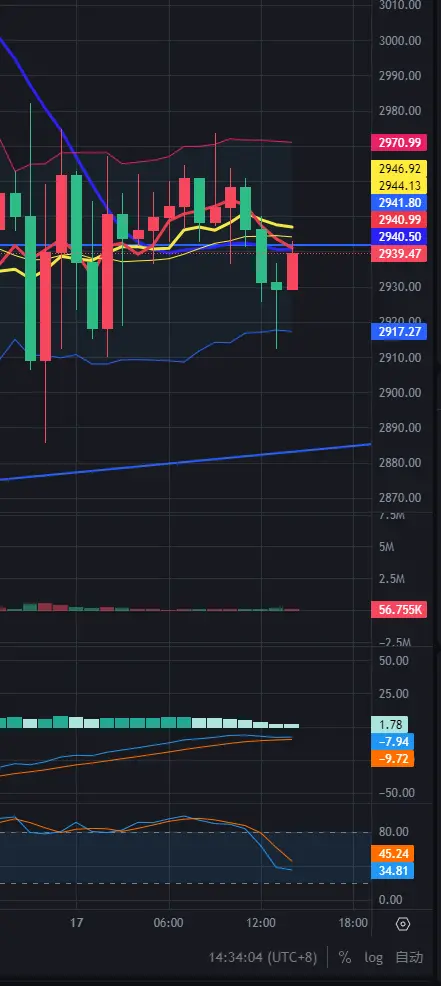
SOL 12.19 14:13 Technical analysis from the hourly perspective shows that the upper Bollinger Band is trending downward, the middle band is trending downward, and the lower band is flat. The three lines correspond to prices: 128-122-116. Currently, the short- and medium-term moving averages show that MA5 and M10 are rising, while M30 is flat. Trading volume is decreasing. The MACD indicator is currently below the zero line with the fast line and signal line moving upward, indicating weakening bearish momentum. The RSI indicator on the hourly chart is in the normal zone with both lines risi
SOL0.25%
View Original
  • Reward
  • Comment
  • Repost
  • Share
Ethereum 12.19 09:13 On December 19th review: Yesterday, Ethereum oscillated within a consolidation platform, rising rapidly to 2980 after adjusting to 2822. Then, after a brief consolidation, it sharply broke below the platform to 2772, moving into the current oscillation range of 2779-2840. Overall, there are signs of upward oscillation. Technical analysis on the hourly chart shows the Bollinger Bands' upper band rising, the middle and lower bands flat, with corresponding prices: 2963-2856-2749. Currently, the short- and medium-term moving averages show MA5 trending upward, M10 trending
ETH1.06%
View Original
  • Reward
  • Comment
  • Repost
  • Share
SOL 12.19 09:13 On December 19th review: Yesterday, SOL oscillated within a platform, adjusting to 122.13 before rising to 129. Then it sharply dropped to 116.71, followed by sideways movement in the 117-120 range. Overall, there are signs of oscillating upward.
Technical analysis from the hourly chart shows the Bollinger Bands' upper band rising, the middle band and lower band falling, with corresponding prices: 128-122-116. Currently, the short- and medium-term moving averages: MA5 is rising, M10 and M30 are falling. Trading volume has decreased. The MACD indicator is below the zero li
SOL0.25%
View Original
  • Reward
  • Comment
  • Repost
  • Share
Ethereum Technical Analysis 12.18 09:13
From the 4-hour view, the Bollinger Bands upper band is rising, the middle band and lower band are falling, with corresponding prices: 3142-2962-2782. Currently, the MA5, M10, and M30 in the short to medium-term moving averages are declining. Trading volume is decreasing. The MACD indicator is currently below the zero line with both lines trending downward, indicating strengthening bearish momentum. The RSI indicator on the 4-hour chart is in the oversold zone with a converging and flattening crossover.
From the hourly view, the Bollinger Bands upper, m
ETH1.06%
View Original
  • Reward
  • Comment
  • Repost
  • Share
#以太坊技术面分析12.17 14:13
$ETH #从4小时看,布林带上轨上行,中轨,下轨下行,三线对应价格:3179-3020-2862。目前中短期均线中的MA5,M10,M30下行。成交量减少。MACD指标目前在0轴下方快线上行,慢线走平 , the bearish momentum is weakening. The RSI indicator on the 4-hour chart is crossing and moving sideways within the normal zone. From the hourly perspective, the upper, middle, and lower bands of the Bollinger Bands are flattening, with corresponding prices of 2970-2944-2917. Currently, the MA5 and M10 in the short to medium-term moving averages are trending downward, while the M30 is flat. Trading volume is decreasing. The MACD indicator is currently above the zero lin
ETH1.06%
View Original
post-image
  • Reward
  • Comment
  • Repost
  • Share
#以太坊技术面分析12.17 09:20 From the 4-hour chart, the Bollinger Bands upper band is rising, the middle band is flat, and the lower band is falling. The corresponding prices for the three lines are: 3187-3030-2873. Currently, the MA5 in the short to medium-term moving averages is rising, while M10 and M30 are falling. Trading volume is decreasing. The MACD indicator is currently below the zero line, with the fast line moving upward and the slow line flat, indicating weakening bearish momentum. The RSI indicator on the 4-hour chart is in the normal zone with a slight upward crossover.
From the hou
ETH1.06%
View Original
post-image
  • Reward
  • Comment
  • Repost
  • Share
Ethereum
Technical Analysis 12.16 14:20
From the 4-hour view, the Bollinger Bands upper band is rising, the middle band and lower band are falling, with corresponding prices at 3204-3067-2931. Currently, the MA5, M10, and M30 in the short to medium-term moving averages are trending downward. Trading volume is decreasing. The MACD indicator is currently below the zero line with both lines trending downward, indicating increasing bearish momentum. The RSI indicator on the 4-hour chart is in the oversold zone, with the fast line moving upward and the slow line downward.
From the hourly view, the
ETH1.06%
View Original
  • Reward
  • Comment
  • Repost
  • Share
  • Trending TopicsView More
  • Pin
Trade Crypto Anywhere Anytime
qrCode
Scan to download Gate App
Community
  • 简体中文
  • English
  • Tiếng Việt
  • 繁體中文
  • Español
  • Русский
  • Français (Afrique)
  • Português (Portugal)
  • Bahasa Indonesia
  • 日本語
  • بالعربية
  • Українська
  • Português (Brasil)