MCBullGrandpa

vip
Age 0.4 Yıl
Peak Tier 0
No content yet
#加密行情预测 ETH Analysis
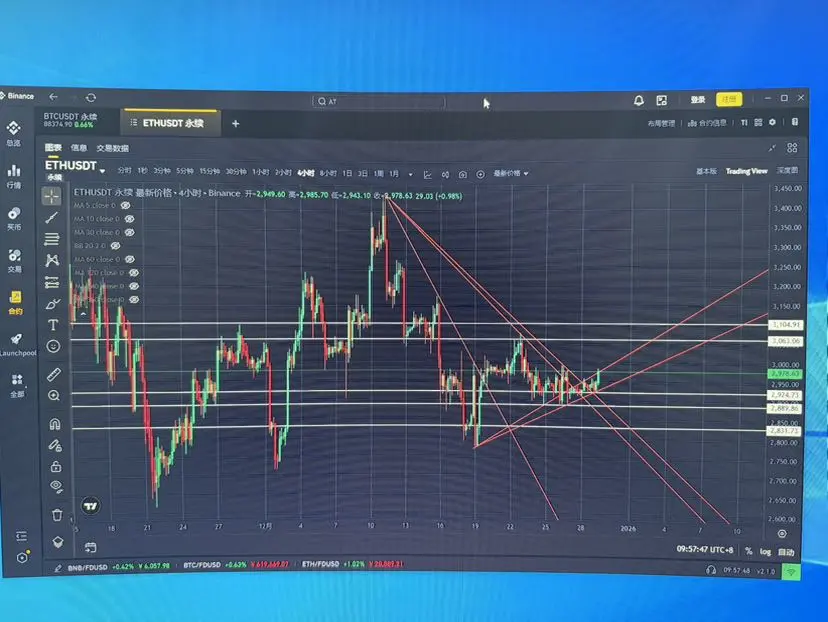
Yesterday's review: Price oscillated upward, rising from 2911 to 3008, then retraced to 2945 and oscillated slightly upward. The entire day saw a fluctuation of 91 points. If following the blogger's yesterday entry point, it was another profitable day.
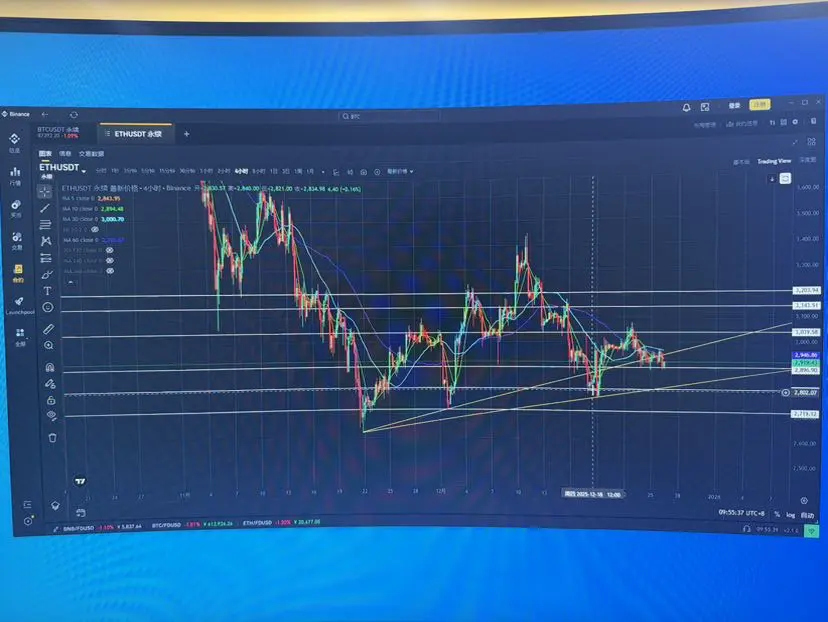
The four-hour chart Bollinger Bands show three lines trending upward, with the price oscillating higher and stabilizing above the middle band. After testing the MA120, there was a slight pullback, with MA30, MA10, and MA5 trending upward below the price. The price stabilized above MA10 and the middle band, attempting to move
ETH4,25%
View Original
  • Reward
  • Comment
  • Repost
  • Share
#ETH走势分析 ETH Analysis
Yesterday's review: the price surged to 3054 but did not break the previous high, then pulled back to 2909. It then oscillated around 2900 again. Those who followed yesterday's analyst's point levels could have caught another wave of gains. The volatility yesterday was characterized by a rise and fall of about 150 points.
After the Bollinger Bands on the 4-hour chart opened up, a horizontal trend began with the three lines. The price broke above the Bollinger Bands yesterday but did not surpass the previous high, then retraced and fell back below the middle band. The MA3
ETH4,25%
View Original
post-image
  • Reward
  • Comment
  • Repost
  • Share
#加密行情预测 ETH Analysis
The four-hour chart Bollinger Bands are widening. After breaking above the upper band, the price failed to surpass the previous high and pulled back. Short-term moving averages are beginning to turn upward. The MA120 below forms a short-term support, while the MA10 is about to cross above the MA60, which is also starting to turn upward. The MACD fast and slow lines are opening above the zero line, indicating increasing bullish momentum. The RSI fast and slow lines are opening upward in the overbought zone, with the fast line overbought and the slow line corresponding to a
ETH4,25%
View Original
  • Reward
  • Comment
  • Repost
  • Share
Exit decisively after the correction once you've eaten, greed will get you trapped
View Original
  • Reward
  • Comment
  • Repost
  • Share
ETH Analysis
The four-hour Bollinger Bands are slightly opening, and after price consolidation, it breaks above the Bollinger Bands. Following the short-term moving averages crossing in a confluence pattern, MA5 and MA10 are beginning to turn upward, looking to test MA240. The MACD fast and slow lines are above the zero line, with a golden cross opening, indicating increasing bullish momentum. The RSI fast and slow lines are crossing in the normal range, showing a horizontal trend. On the one-hour chart, the Bollinger Bands are opening, and the price has broken above the upper band. The short-
ETH4,25%
View Original
post-image
  • Reward
  • Comment
  • Repost
  • Share
#加密市场小幅回暖 ETH Analysis
Yesterday's review: The price has been in a consolidation phase over the past few days. After a slight upward push, it did not break the previous high. In the evening, it tested the lows again but did not break the consolidation range, then retraced.
The four-hour Bollinger Bands are narrowing, with the MA5 and MA10 forming a downward crossover, and the price has retraced below MA5. The MACD fast and slow lines are crossing below the zero line but the crossover has not fully opened. The RSI fast and slow lines are declining in the normal zone, with the fast line suddenl
ETH4,25%
View Original
post-image
  • Reward
  • Comment
  • Repost
  • Share
#加密市场小幅回暖 ETH Analysis
The four-hour Bollinger Bands are narrowing. The price line tests the lower band and then rebounds, stabilizing above the middle band and continuing to rise. The MA5 and MA10 are turning upward. The price has returned above MA5 and stabilized. On the hourly chart, it stays above MA30; if it remains above MA30, the market may rise again. The MACD fast and slow lines are slightly opening in a bullish crossover below the zero line, indicating that bullish momentum is beginning to build. The RSI fast and slow lines are crossing in the normal zone, forming a small golden cros
ETH4,25%
View Original
  • Reward
  • Comment
  • Repost
  • Share
#加密市场小幅回暖 ETH Analysis
Yesterday's review: The price broke above the Bollinger Bands on the 8-hour chart but failed to sustain and instead declined back below the lower band after a pullback. The entry point analyzed by the blogger was reached yesterday; following this point would have been a profitable day.
The 4-hour Bollinger Bands are narrowing; after the price broke below the lower band, it rebounded and pulled back. Moving averages are all trending downward, with MA5 and MA10 crossing below MA60 in a death cross. The MACD fast and slow lines are crossing below the zero line in a converg
ETH4,25%
View Original
post-image
  • Reward
  • 1
  • Repost
  • Share
JianghuShaoxiavip:
#加密市场小幅回暖# ETH Analysis
Yesterday's review: The price broke above the Bollinger Bands on the 8-hour chart but failed to sustain and instead declined back below the lower band after a pullback. The entry point analyzed by the blogger was reached yesterday; following this point would have been a profitable day.
The 4-hour Bollinger Bands are narrowing; after the price broke below the lower band, it rebounded and pulled back. Moving averages are all trending downward, with MA5 and MA10 crossing below MA60 in a death cross. The MACD fast and slow lines are crossing below the zero line in a converging pattern, indicating unstable bearish momentum. The RSI fast and slow lines are in the normal zone, with a death cross turning downward. The 1-hour Bollinger Bands are opening up; after the price broke below the lower band, it retraced to test MA5, MA30, and MA60, with a downward converging cross. The MACD fast and slow lines are crossing below the zero line in a converging pattern, weakening bearish momentum. The RSI fast and slow lines are below the zero line and are about to form a golden cross, with the fast line moving upward.
Conclusion: The market is oscillating with a slight upward bias; in the short term, it is testing the upside without breaking the 4-hour MA10 (the midline on the 1-hour chart), maintaining sideways movement.
Resistance: 3039 3143 3203
Support: 2890 2809
Strategy: If the price does not break above 3007, small short positions can be taken; add to positions at 3039. Second addition at 3143.
The four-hour chart Bollinger Bands are slightly opening downward, with the middle band trending downward. The price broke below the lower Bollinger Band and then rebounded upward without breaking the MA60, but it has stabilized above the MA5. Except for the MA5 turning upward, all other moving averages are downward. The medium- and short-term moving averages are arranged sequentially downward. The MACD fast and slow lines are forming a golden cross below the zero line, indicating decreasing bearish momentum. The RSI fast and slow lines are forming a golden cross and rising, moving from the ov
View Original
post-image
  • Reward
  • Comment
  • Repost
  • Share
#美股圣诞行情开启 ETH Analysis
Yesterday's review: the market oscillated and declined to 2888, then rebounded and retraced. It did not break above the four-hour MA60 and then oscillated again. Following the trader's entry points from yesterday, it was another frustrating day. Due to the US stock market being closed for ➕ Christmas, there was little volatility.
The four-hour Bollinger Bands are slightly opening downward, with the middle band trending down. The price broke below the lower band but rebounded upward without breaking the MA60, although it stabilized above the MA5. Except for the MA5 t
ETH4,25%
View Original
  • Reward
  • Comment
  • Repost
  • Share
#ETH走势分析 ETH Analysis
The four-hour Bollinger Bands are opening downward, with the price oscillating and declining, not breaking the middle band line, and once again testing the lower band. Short-term moving averages are trending downward and crossing below medium- and long-term averages, with medium-term averages turning downward after a complex crossover. The price has been unable to break above the MA10 during the upward correction. The MACD fast and slow lines are below the zero axis, with a death cross opening again and a second increase in bearish momentum. The RSI fast and slow lines a
ETH4,25%
View Original
post-image
  • Reward
  • Comment
  • Repost
  • Share
#ETH走势分析 ETH analysis
In the four-hour chart, the Bollinger Bands are horizontal, and the price is about to break below the lower Bollinger Band. The short- to medium-term moving averages are slightly upward, with the ma5 turning down. The MACD fast and slow lines are forming a death cross above the zero axis, with the fast line about to cross below the zero axis, increasing bearish momentum. The RSI fast and slow lines are declining, with the fast line entering the oversold area, showing a horizontal trend, and the fast line continues downward. In the one-hour chart, the Bollinger Bands are o
ETH4,25%
View Original
  • Reward
  • Comment
  • Repost
  • Share
#加密市场小幅回暖 ETH analysis, yesterday ETH tested the middle band of the daily chart upwards but did not break, pulling back above the ma5, oscillating and rising. Following the blogger's point from yesterday is where one can make money.
Technical analysis of the four-hour chart shows that the Bollinger Bands' three lines are closing horizontally. The three lines correspond to prices 3044, 2996, and 2947. If the price stabilizes above the four-hour middle band, it will continue to test the daily chart's middle band upwards. The four-hour MA240 is forming a short-term resistance. The MA
ETH4,25%
View Original
  • Reward
  • Comment
  • Repost
  • Share
  • Pin

Trade Crypto Anywhere Anytime
qrCode
Scan to download Gate App
Community
  • بالعربية
  • Português (Brasil)
  • 简体中文
  • English
  • Español
  • Français (Afrique)
  • Bahasa Indonesia
  • 日本語
  • Português (Portugal)
  • Русский
  • 繁體中文
  • Українська
  • Tiếng Việt