Max_JunGe

vip
Market Analyst
Futures Trading Strategist
Crypto Market Researcher
No content yet
🔔 November 24th Bitcoin Market Trend Analysis:
Daily resistance range for Bitcoin 88950-88150
The intraday support range for the pancake is 85470-84650
Market Analysis
The recent hourly candlestick chart of the Bitcoin shows a fluctuating trend, with prices oscillating between 86700 and 87000. The integer level of 87000 has been tested multiple times without breakthrough. On the daily chart, yesterday's closing price was lower than the previous day's opening price, forming a bearish candle. However, it is still in a high-level consolidation overall. The MACD on the hourly level has th
BTC-0,78%
View Original
post-image
  • Reward
  • Comment
  • Repost
  • Share
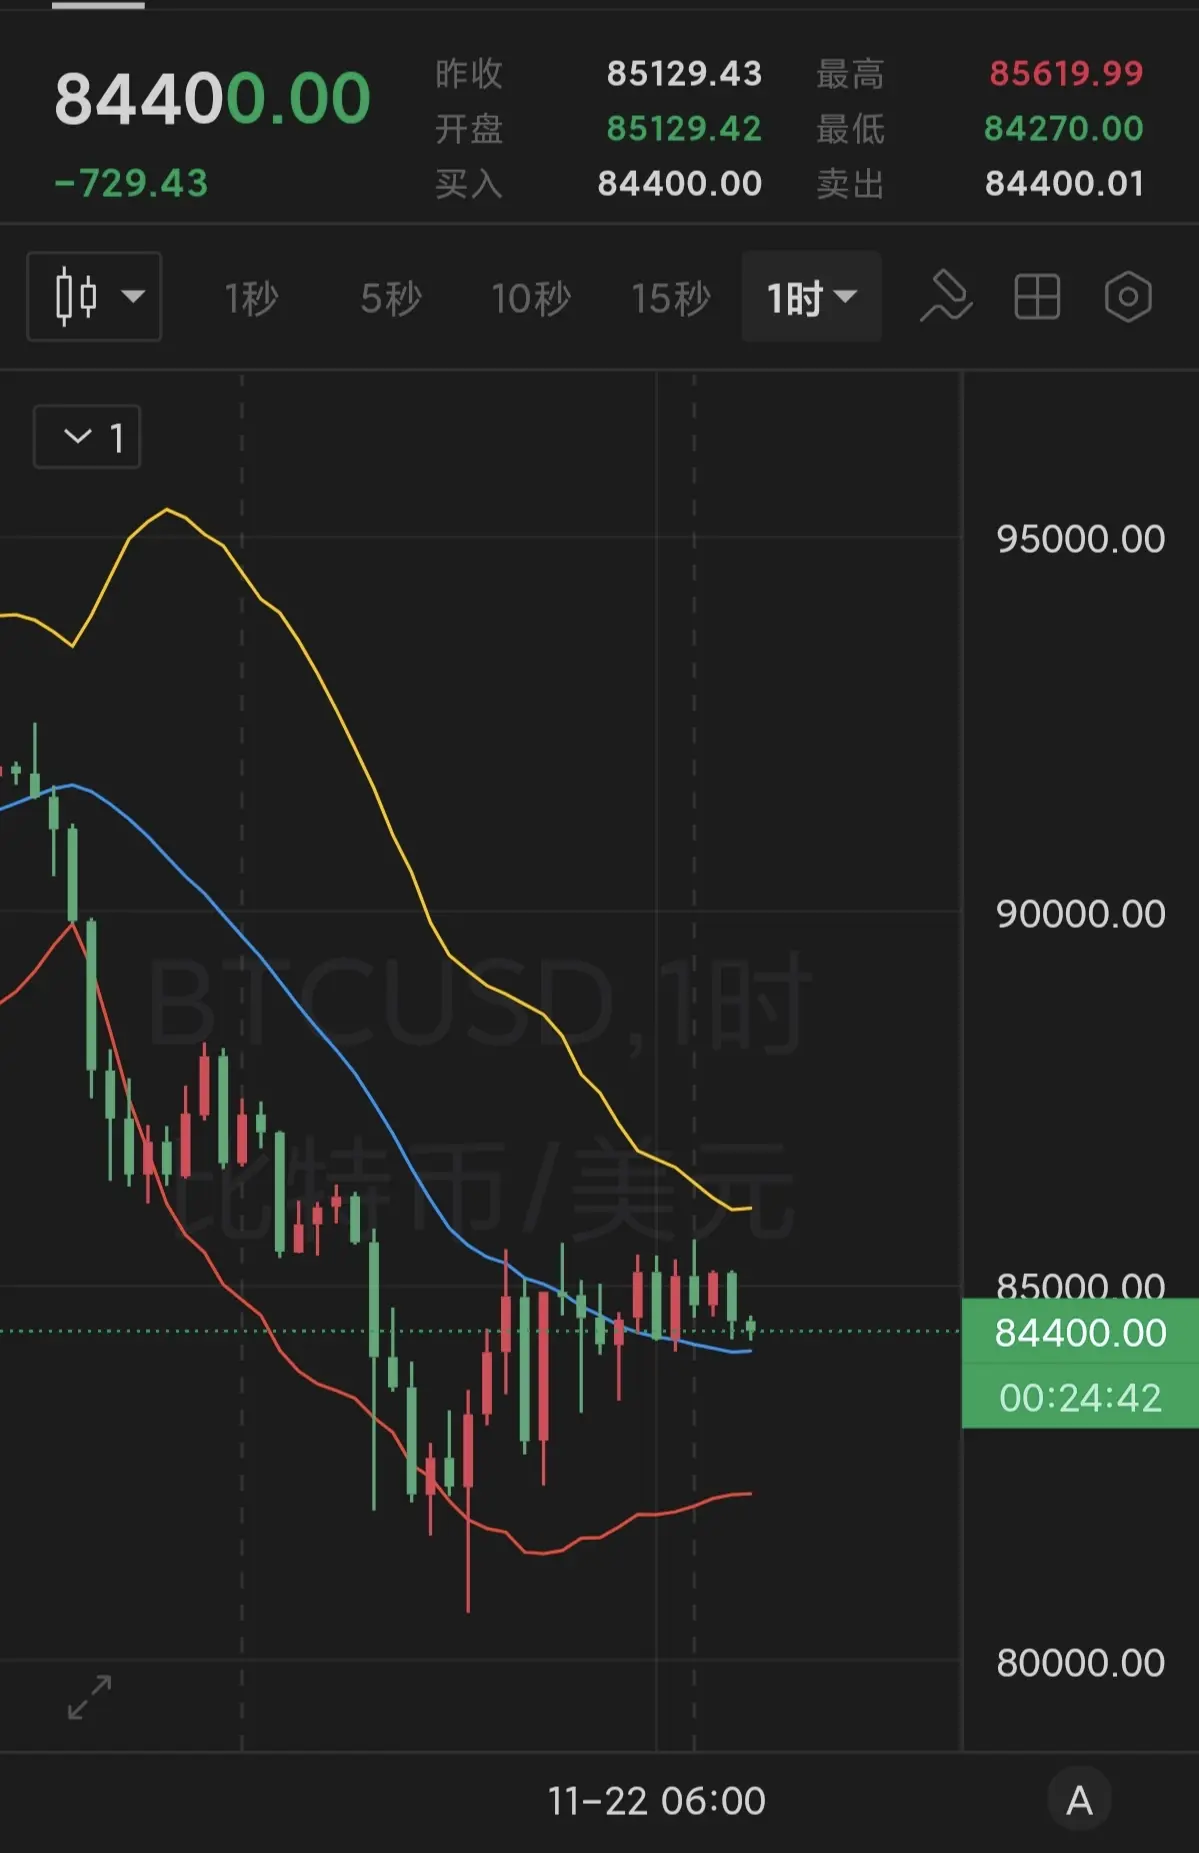
🔔Ether market trend analysis on November 24:
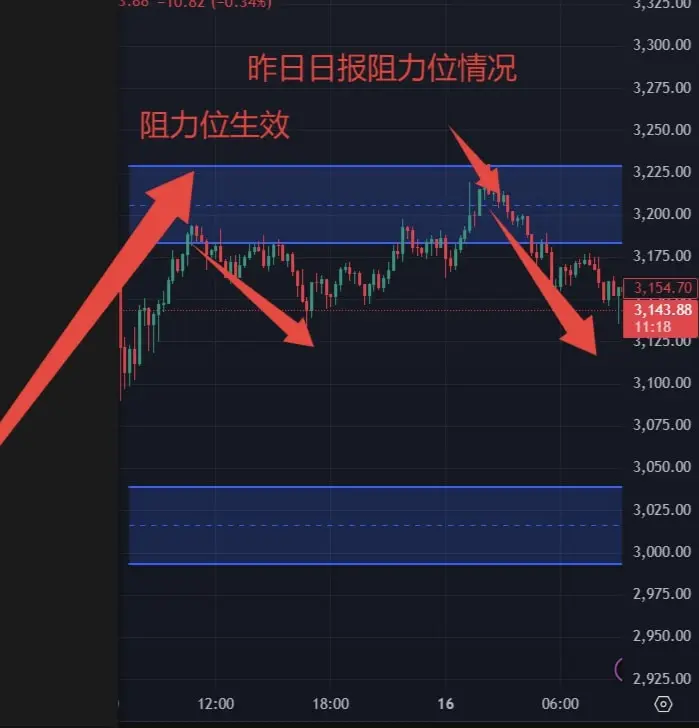
Ether intraday resistance range 2874-2856
Ether intraday support range 2765-2745
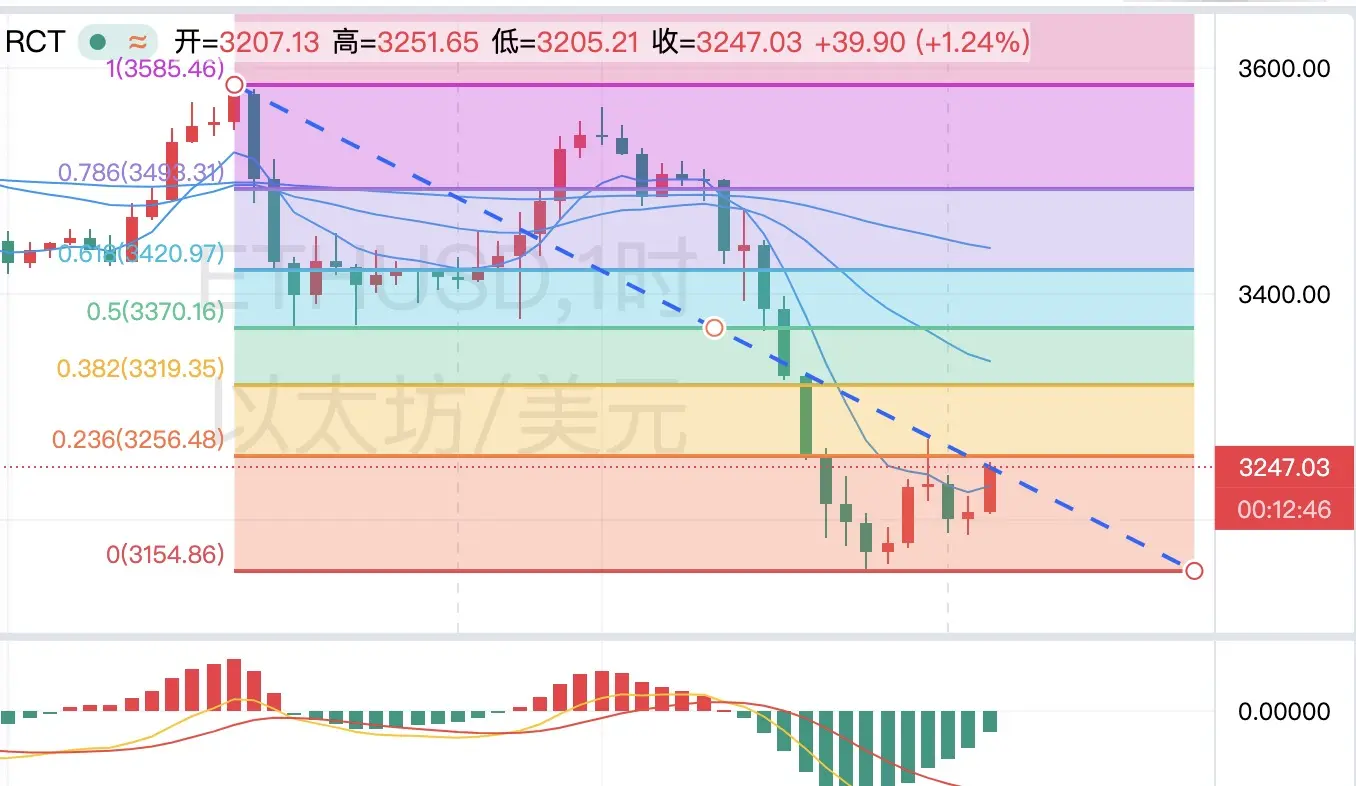
The ETH recent candlestick chart shows a trend of oscillating downward, with the price gradually retreating from the high of 2858 on the 23rd to around 2794 currently. There is a long upper shadow ( as seen on the 24th at 08:00 ), indicating significant selling pressure above. After the MACD DIF and DEA formed a death cross, they continued to diverge downwards, currently in a bearish area, but the green bars are shortening, which may indicate a demand for a rebound. Th
ETH0,08%
View Original
  • Reward
  • Comment
  • Repost
  • Share
🔔Analysis of Ether market trends on November 22:
Auntie's daily resistance range 2865-2928
The support range of Auntie Tai in the intraday is 2665-2605.
The price of ETH has recently shown a fluctuating trend, experiencing a significant drop on the 21st before gradually rebounding, but overall it remains in a downward trend. The daily level has formed a long upper shadow line and a bearish candlestick combination, indicating heavy selling pressure above. The MACD histogram on the hourly timeframe has turned from negative to positive, and the fast and slow lines are starting to converge bu
ETH0,08%
View Original
post-image
  • Reward
  • Comment
  • Repost
  • Share
🔔Market Trend Analysis for Bitcoin on November 22:
Daily resistance range for Bitcoin 87700-89350
The daily support range for the pancake is 82470-80850
Market Analysis
The daily chart shows that the recent price trend is exhibiting a downward fluctuation, with a significant drop on the 21st from a high of 87498.94 to a low of 80600(, forming a long upper shadow and a large bearish candlestick, indicating that the bearish forces are dominant. On the hourly chart, the price has some support around 84800, but overall it is still in a weak rebound state and has not been able to break through the
BTC-0,78%
View Original
post-image
  • Reward
  • Comment
  • Repost
  • Share
🔔November 21 Market Trend Analysis of Bitcoin:
Resistance range for the pancake within the day 89300-90950
The support range for the pancake within the day is 83900-82250.
Market Analysis
The daily chart for BTC shows a continuous decline in price recently, with a long bearish candle on the 20th, indicating strong bearish forces. Today, although there is a rebound on the 21st, the strength is limited, and it is still in a low-level consolidation. The hourly chart depicts a short-term rebound followed by a pullback, with highs gradually decreasing and lows also declining, overall showing weakn
BTC-0,78%
View Original
  • Reward
  • Comment
  • Repost
  • Share
🔔Analysis of the Ether market trend on November 21:
Auntie's daily resistance range 2938-3002
Aunt's daily support range 2728-2663
The ETH daily chart shows that the recent price has rapidly fallen from a high of 3063 to 2788 and then rebounded, currently oscillating around 2870, forming signs of a short-term low stabilization. On the hourly chart, a long lower shadow candlestick appeared in the morning of the 21st, indicating strong support around 2850. However, there is obvious pressure in the upper 2885 area. The MACD histogram on the hourly chart is still negative, with both the D
ETH0,08%
View Original
  • Reward
  • Comment
  • Repost
  • Share
🔔 Market trend analysis for Bitcoin on November 20:
Daily resistance range for Bitcoin 93180-94200
The daily support range for the pancake is 89850-88800
The recent hourly candlestick chart for Bitcoin shows a continuous upward trend, with the price rising from 90480.56 to 92318.13, forming multiple bullish candles, indicating a strong short-term rebound. The daily candlestick chart closed with a long lower shadow yesterday, and after the market opened today, it continued to rise, suggesting strong buying support at lower levels. The MACD histogram on the hourly chart is gradually expanding,
BTC-0,78%
View Original
post-image
  • Reward
  • Comment
  • Repost
  • Share
🔔Analysis of Ether market trends on November 20:
Ether intraday resistance range 3120-3180
Ether intraday support range 2928-2868
The daily chart for Ether shows that the recent price has fallen from 3123 to 3035, forming a series of consecutive bearish candles before a slight rebound. Overall, it presents a trend of oscillating downward. On the hourly chart, there was a rebound near the low point of 2984 in the morning of the 20th, and it is currently in a short-term uptrend. However, there is significant pressure above. The MACD on the hourly chart shows that the DIF and DEA are gradually c
ETH0,08%
View Original
post-image
  • Reward
  • Comment
  • Repost
  • Share
🔔Analysis of BTC market trends on November 18:
BTC intraday resistance range 94700-95800
BTC intraday support range 91150-90050
The daily chart of BTC shows that the recent price is fluctuating at a high level, with a long lower shadow appearing on the 18th, indicating strong buying support at the lows. The hourly chart has formed a short-term rebound, but overall it is still in a downward trend, with highs gradually decreasing and lows also rising, presenting a converging triangle pattern. The MACD histogram on the hourly chart has turned from red to green, with the fast and slow lines appro
BTC-0,78%
View Original
post-image
  • Reward
  • Comment
  • Repost
  • Share
🔔Analysis of Ether market trends on November 18:
Ether intraday resistance range 3208-3262
Ether intraday support range 3036-2983
The recent price of Ether has been fluctuating around 3100. After a significant rise on the 18th, it has corrected and is currently in a high-level consolidation phase. The daily chart shows a rebound after a previous sharp decline, with a relatively long upper shadow and a small real body candlestick, indicating strong resistance above. The MACD on the hourly level shows weakening bullish momentum, with the red bars shortening and the fast and slow lines gradually
ETH0,08%
View Original
post-image
  • Reward
  • Comment
  • Repost
  • Share
🔔Analysis of ETH market trend on November 18:
ETH intraday resistance range 3131-3190
ETH intraday support range 2930-2867
The daily chart for ETH shows that on the 17th, there was a long lower shadow, indicating some buying support at lower levels, but overall it is still in a downtrend, with bearish forces prevailing; the moving averages are in a bearish arrangement, and the current price is constrained by EMA7 resistance. Hourly trading volume has shrunk, and market sentiment is quite cautious. After the increase in daily trading volume, it has gradually retreated, indicating that the sell
ETH0,08%
View Original
post-image
  • Reward
  • Comment
  • Repost
  • Share
🔔BTC market trend analysis on November 18:
BTC intraday resistance range 94000-95100
BTC intraday support range 90350-89200
The daily chart for BTC shows a recent downward trend in prices with consecutive days of bearish closes and gradually decreasing highs. The hourly chart experienced a significant pullback during the 2100 period on the 17th, and is currently in a phase of low-level consolidation. The daily chart also indicates a bearish dominance, approaching an oversold area, with a potential for a short-term rebound demand, but the overall trend remains bearish. The daily trading volume
BTC-0,78%
View Original
post-image
  • Reward
  • Comment
  • Repost
  • Share
November 16th ETH market trend analysis:
ETH intraday resistance range 3213-3241
ETH intraday support range 3120-3092
ETH has shown a downward trend in price recently. On the 16th, the hourly K-line displayed several small bearish candles, indicating weak rebound strength. The daily chart shows significant price surges and drops over the past few days, and it is currently in a correction phase, overall showing weakness. The MACD on the hourly chart continues to operate below the zero axis, with both DIF and DEA being negative, suggesting bearish momentum is dominant. However, the green bars ar
ETH0,08%
View Original
post-image
  • Reward
  • Comment
  • Repost
  • Share
November 16 BTC market trend analysis:
BTC intraday resistance range 96439-96950
BTC intraday support range 94700-94150
The daily chart for BTC shows recent prices oscillating at a high level, with a long upper shadow on the 15th, indicating heavy selling pressure above. A bearish candle was formed on the 16th, suggesting potential short-term pullback pressure. The hourly chart shows a series of small fluctuations in a consolidation trend. Currently, the K-line has not broken through the previous high resistance around 95704, while the support at 95040 remains effective. The MACD on the hourl
BTC-0,78%
View Original
post-image
  • Reward
  • 1
  • 1
  • Share
TransplantingRiceSeedlvip:
BEES BTC ETH Buy, buy, buy at such a low market capitalization, let's all buy together, Consensus whatever coin will rise, whatever Bitcoin relies on everyone's Consensus, the lower the market capitalization, the greater the opportunity, the bees, honey is very sweet, making people have memory, he is the diligent little bee, wherever there are flowers, the little bee goes, he is the representative of beauty, everyone Consensus buy, buy, buy, immediately it will turn into 999 $Whale will come right away, still buy, buy, buy. In the future, wherever life is beautiful, go there.
🔔 Analysis of ETH market trends on November 14:
ETH intraday resistance range 3387-3484
ETH intraday support range 3073-2975
ETH's recent price has shown a downward trend, experiencing a significant drop on the 13th, with a high of 3565.84 followed by consecutive bearish candles. The current K-line is forming a slight rebound around 3200, but overall remains weak. The MACD on the hourly level continues to show negative values, with the fast and slow lines diverging downwards, indicating strong bearish pressure; on the daily level, the MACD has crossed bearish and continues to decline, wit
ETH0,08%
View Original
post-image
  • Reward
  • Comment
  • Repost
  • Share
🔔November 14th Bitcoin Market Trend Analysis:
Resistance range for the pancake within the day 101950-103400
The intraday support range for Bitcoin is 97350-95900.
The daily chart for Bitcoin shows a continuous decline in price recently, forming a series of bearish candlesticks, especially the long upper shadows on the 13th and 12th, indicating heavy selling pressure above. There has been a slight rebound near 99126 on the hourly chart, but overall, it remains in a weak sideways trend, with highs gradually decreasing and lows also constantly moving downwards. The MACD histogram on the hourly c
BTC-0,78%
View Original
  • Reward
  • Comment
  • Repost
  • Share
  • Pin

Trade Crypto Anywhere Anytime
qrCode
Scan to download Gate App
Community
  • بالعربية
  • Português (Brasil)
  • 简体中文
  • English
  • Español
  • Français (Afrique)
  • Bahasa Indonesia
  • 日本語
  • Português (Portugal)
  • Русский
  • 繁體中文
  • Українська
  • Tiếng Việt