Decoding SUI Price Movements: Why the Breakthrough Above $1.68 Could Extend the Uptrend?
On December 31st, the market reported that Bitwise has officially filed for the issuance of 11 cryptocurrency ETF funds, with Sui being one of the notable altcoins included in the list.
Following this development, the price of SUI surged strongly, increasing nearly 19% in just three days, attracting significant investor interest.
Currently, Bitcoin is approaching and testing an important resistance zone around the $90,000 mark. Notably, Bitcoin’s dominance rate has decreased significantly since 12/30, indicating that capital is shifting towards the altcoin market.
In this context, the question arises whether the current upward momentum has enough strength to sustain, and whether Sui (SUI) is facing an opportunity to form a sustainable growth trend in the near future.
Why Sui could increase by another 70%
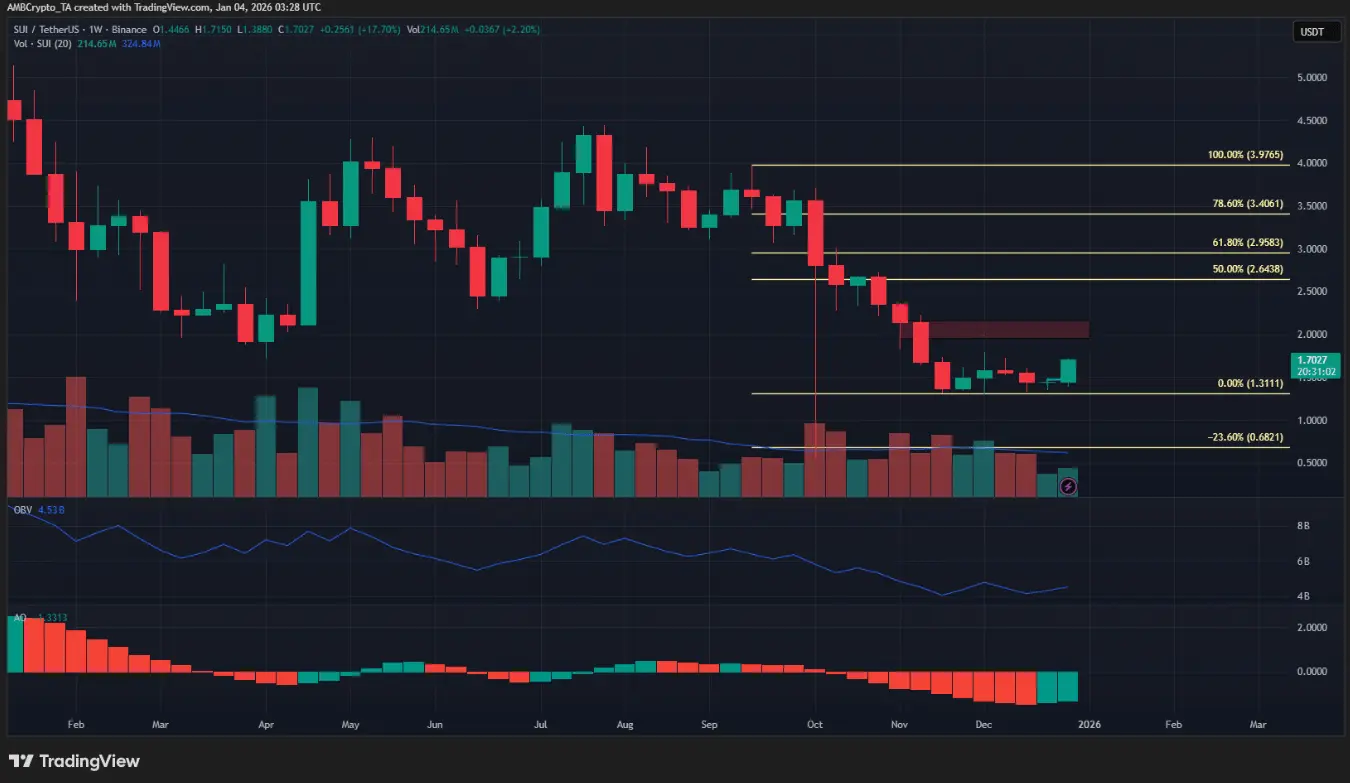 Weekly SUI/USDT chart | Source: TradingViewOn the weekly timeframe, the main trend of SUI remains bearish, although the recent recovery has attracted market attention. However, if the weekly candle can close firmly above the $1.79 level, this will send a positive signal that the bulls are temporarily regaining control and open up hope for a more noticeable recovery phase.
At that point, the price could be pushed towards higher target zones at $2.95 and $3.4 — important Fibonacci retracement levels acting as resistance above.
Nevertheless, momentum indicators and buying pressure on this timeframe still do not show a clear breakout, implying that the current rally may only be a technical rebound after previous weakness.
Potential reversal at the peak of the range
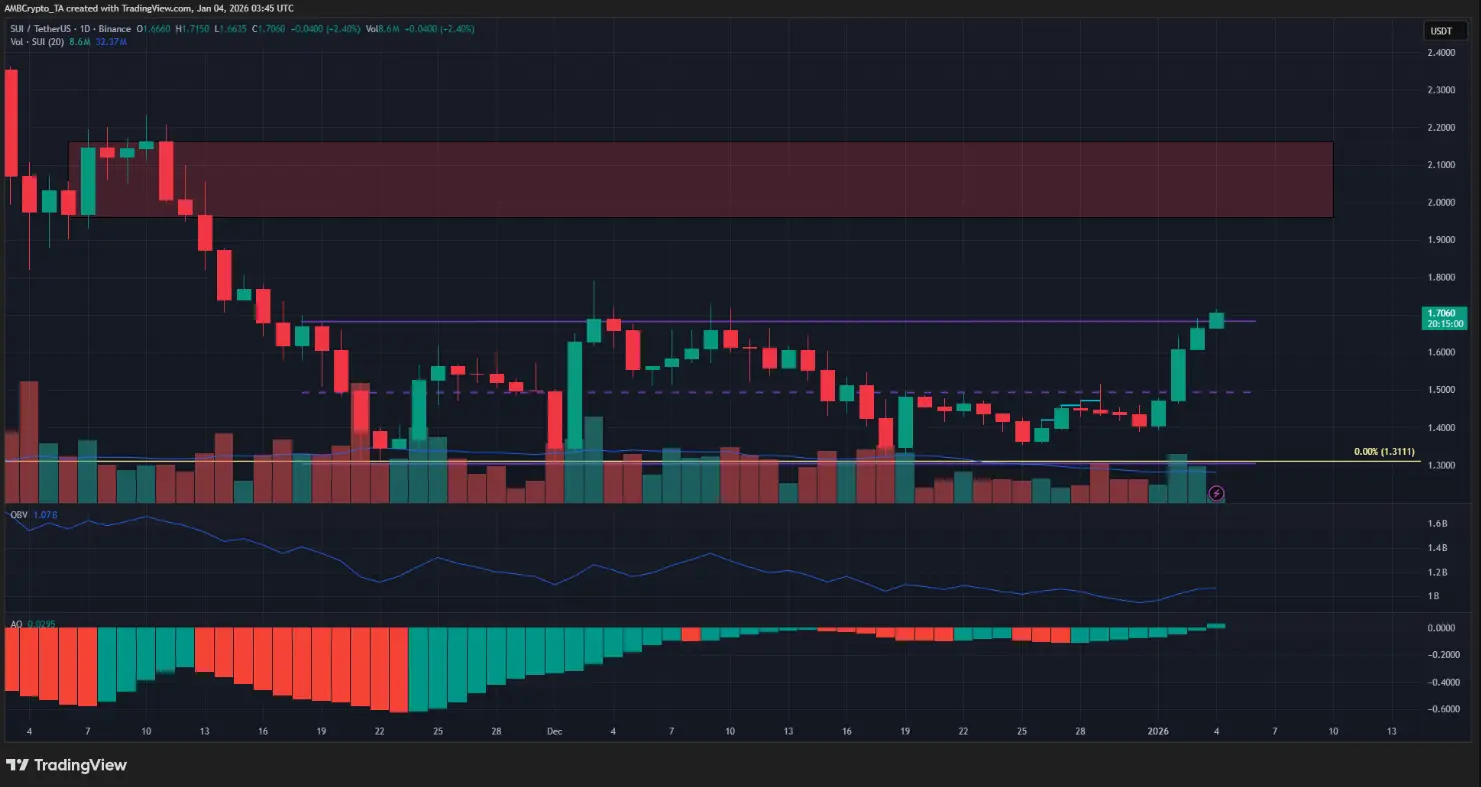 Daily SUI/USDT chart | Source: TradingViewThe oscillation pattern within the (purple zone) indicates an important peak at $1.68. At the time of writing, SUI is trading steadily above this level. If the price can record a clear daily candle closing above the upper boundary of the range, it will be a strong signal to reinforce confidence in the upward trend.
Conversely, failure to break out of the current range could serve as an early warning of increasing selling pressure and the risk of rejection. However, based on current developments, this negative scenario is considered unlikely.
Action for traders: Buy on breakout
The OBV indicator is gradually rising, while the Awesome Oscillator shows a bullish crossover — signs that demand and market momentum are improving significantly. At the same time, Bitcoin (BTC) has successfully broken through the local resistance zone around $90,000, further boosting momentum and reinforcing broad positive sentiment.
Based on the weekly chart signals, traders may consider a buy strategy upon confirmation of a breakout, aiming for higher targets, notably around the $3.40 zone.
Related Articles
The key breakthrough of XRP against Bitcoin is still ongoing, analysts predict XRP could surge by 620%, with a target price of $10
Trump promotes cryptocurrency regulatory framework, Bitcoin surges, driving crypto stocks higher across the board
Altcoin attention drops to a two-year low, market funds shift to Bitcoin. When will the next altcoin season arrive?
Bitcoin Experiences Bullish Pump Reclaiming $73,000 in the Last 24 Hours and Sparking Hope
Bittensor (TAO) signals a recovery amid weakening retail demand