On December 31st, the market reported that Bitwise has officially filed for the issuance of 11 cryptocurrency ETF funds, with Sui being one of the notable altcoins included in the list.
Following this development, the price of SUI surged strongly, increasing nearly 19% in just three days, attracting significant investor interest.
Currently, Bitcoin is approaching and testing an important resistance zone around the $90,000 mark. Notably, Bitcoin’s dominance rate has decreased significantly since 12/30, indicating that capital is shifting towards the altcoin market.
In this context, the question arises whether the current upward momentum has enough strength to sustain, and whether Sui (SUI) is facing an opportunity to form a sustainable growth trend in the near future.
Why Sui could increase by another 70%
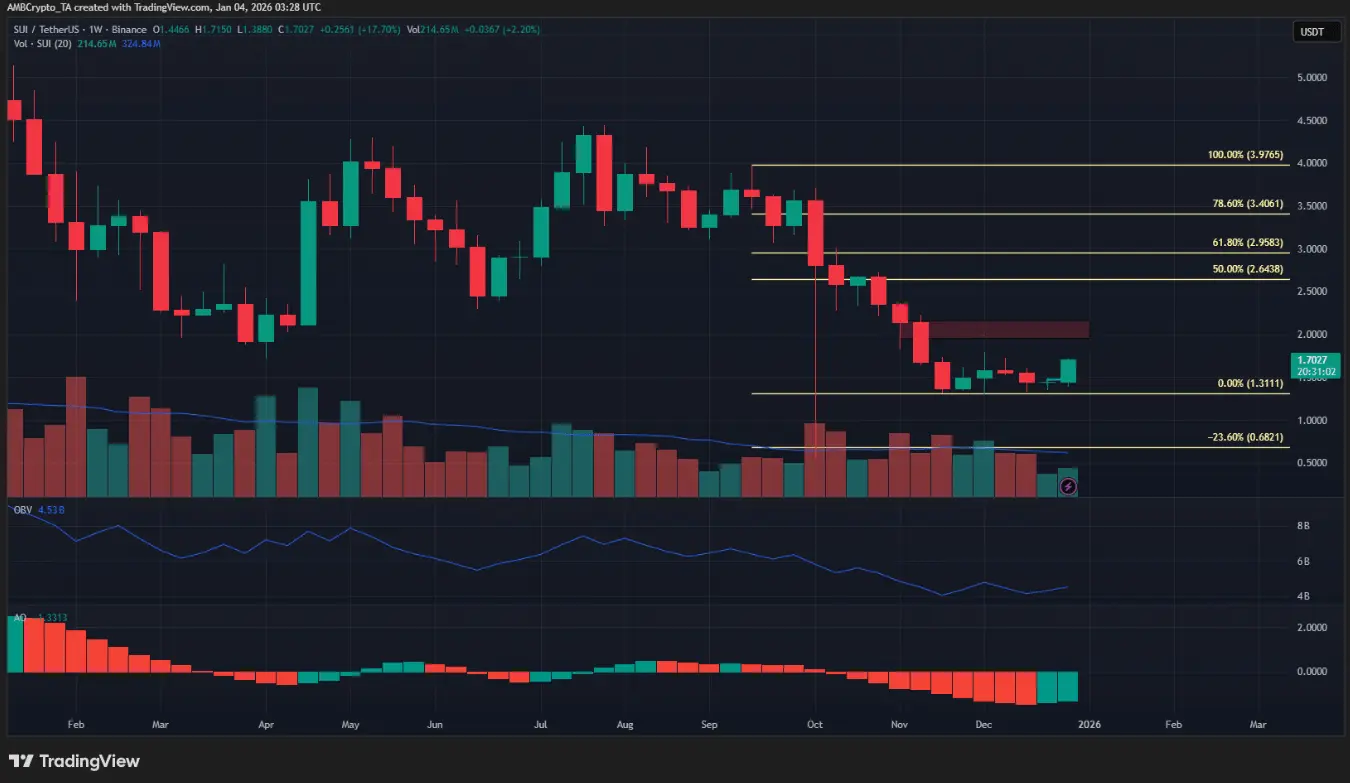 Weekly SUI/USDT chart | Source: TradingViewOn the weekly timeframe, the main trend of SUI remains bearish, although the recent recovery has attracted market attention. However, if the weekly candle can close firmly above the $1.79 level, this will send a positive signal that the bulls are temporarily regaining control and open up hope for a more noticeable recovery phase.
At that point, the price could be pushed towards higher target zones at $2.95 and $3.4 — important Fibonacci retracement levels acting as resistance above.
Nevertheless, momentum indicators and buying pressure on this timeframe still do not show a clear breakout, implying that the current rally may only be a technical rebound after previous weakness.
Potential reversal at the peak of the range
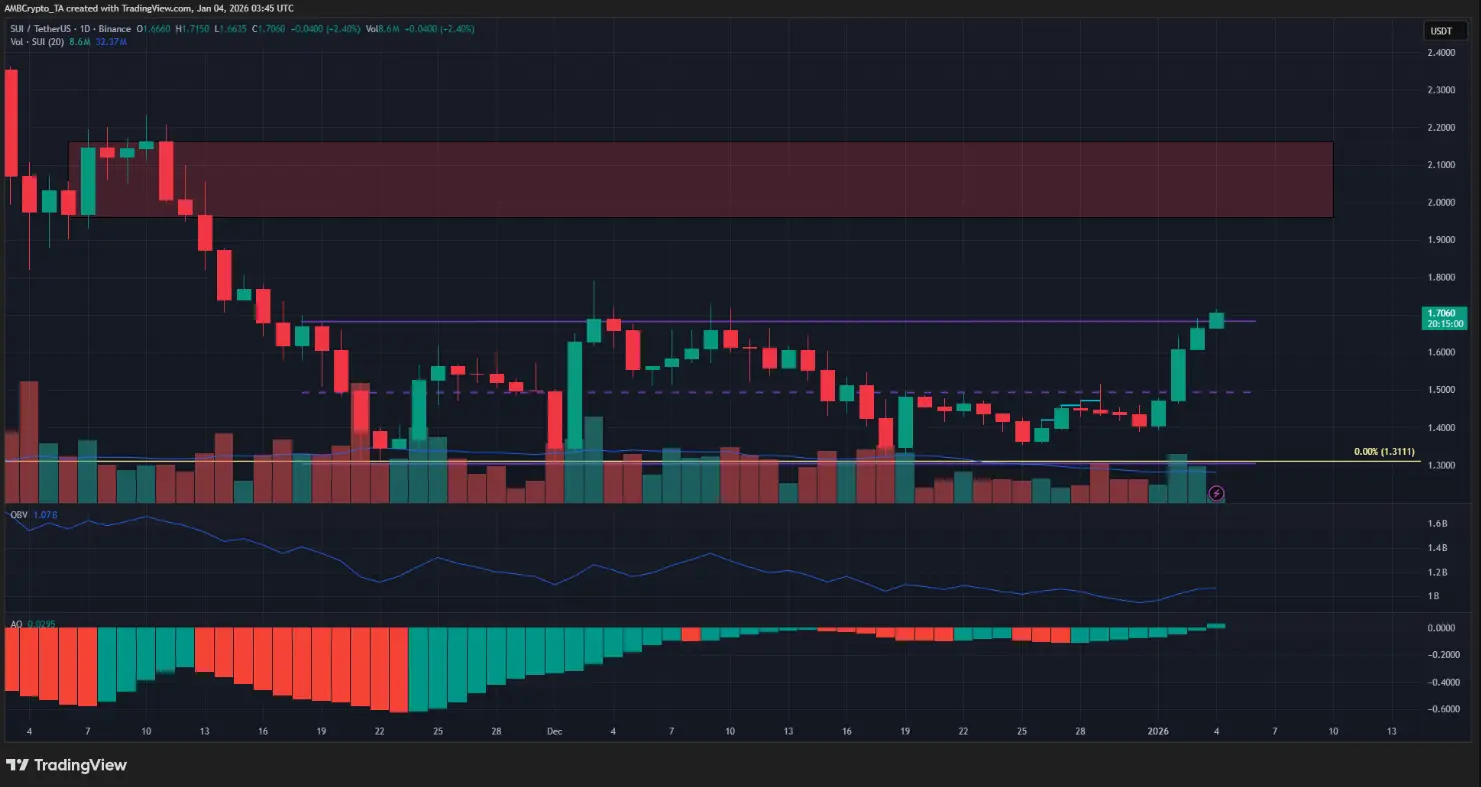 Daily SUI/USDT chart | Source: TradingViewThe oscillation pattern within the (purple zone) indicates an important peak at $1.68. At the time of writing, SUI is trading steadily above this level. If the price can record a clear daily candle closing above the upper boundary of the range, it will be a strong signal to reinforce confidence in the upward trend.
Conversely, failure to break out of the current range could serve as an early warning of increasing selling pressure and the risk of rejection. However, based on current developments, this negative scenario is considered unlikely.
Action for traders: Buy on breakout
The OBV indicator is gradually rising, while the Awesome Oscillator shows a bullish crossover — signs that demand and market momentum are improving significantly. At the same time, Bitcoin (BTC) has successfully broken through the local resistance zone around $90,000, further boosting momentum and reinforcing broad positive sentiment.
Based on the weekly chart signals, traders may consider a buy strategy upon confirmation of a breakout, aiming for higher targets, notably around the $3.40 zone.
Disclaimer: The information on this page may come from third parties and does not represent the views or opinions of Gate. The content displayed on this page is for reference only and does not constitute any financial, investment, or legal advice. Gate does not guarantee the accuracy or completeness of the information and shall not be liable for any losses arising from the use of this information. Virtual asset investments carry high risks and are subject to significant price volatility. You may lose all of your invested principal. Please fully understand the relevant risks and make prudent decisions based on your own financial situation and risk tolerance. For details, please refer to
Disclaimer.
Related Articles
Sonic Price May Experience Technical Reversal: RSI Bullish Divergence Emerges, $0.03 Becomes a Key Support Level
Sonic token recently found support at $0.03, and the RSI shows a bullish divergence, indicating weakening downside momentum. If the support remains effective, the price could rebound to $0.04. Both technical and fundamental analyses show positive signals, but if the key support is broken, bears may regain control.
GateNews49m ago
Ethereum funding rate turns negative! ETF outflows, staking yields are lower than stablecoins
Ethereum perpetual contract funding rates turn negative, indicating increased demand for shorts and a clear market bearish sentiment. Institutional demand remains weak, partly due to relatively low staking yields and a lack of sustained capital inflows. On-chain data and technical developments have failed to boost confidence, but Ethereum's DeFi ecosystem still maintains a strong moat. It is necessary to observe a rebound in funding rates and improvements in transaction fee revenue to determine the future market trend.
MarketWhisper57m ago
Bitcoin stabilizes above $70,000, IEA may release the largest-ever crude oil reserves, global risk asset sentiment improves
Bitcoin recently broke through $70,000 again, influenced by changes in the energy market. Its price once reached $71,612 before falling back to $70,036. The market sentiment is related to discussions with the International Energy Agency about releasing strategic oil reserves, and the decline in Brent crude oil prices is seen as a signal to reduce inflation pressure. The market is focused on the Federal Reserve policy meeting, with expectations that if oil prices remain below $90, it will create room for interest rate cuts.
GateNews1h ago
Bitcoin derivatives market turns bullish, traders bet on BTC surging past $80,000
Bitcoin market sentiment is improving, with more traders expecting the price to break above $80,000 in the coming months. The options market signals a bullish bias. Currently, Bitcoin is trading near $70,000, and analysts believe that if the bullish sentiment continues, a new directional move may emerge in the future.
GateNews1h ago
XRP Ledger daily trading volume soars to 2.7 million transactions, RWA enthusiasm heats up, but XRP price remains trapped in the $1.34—$1.44 range
XRP price has recently been volatile, staying between $1.34 and $1.44. However, XRP Ledger transaction activity has increased, with a daily trading volume of 2.7 million transactions, mainly driven by real-world asset tokenization projects. Analysts point out that the market is in a consolidation phase, with a focus on the stability of the $1.34-$1.35 support level. If this support holds, a breakout above $1.44 could be possible.
GateNews1h ago
Ethereum network activity reaches a new all-time high, but ETH price has fallen 30% over 6 months, ranking third in fee revenue.
Ethereum network activity reaches a new all-time high, with multiple indicators showing a significant increase in daily active addresses and smart contract calls. However, ETH price has fallen about 30% over the past six months, indicating a net capital outflow. Analysis suggests that capital flows have a greater impact on price. Despite Ethereum hosting a large amount of stablecoins, its value capture has not kept pace with the growth in network usage.
GateNews1h ago