
According to an analysis published on X on April 30 by the crypto research firm Delphi Digital, backtest results for holding periods since May 2016 show that after including staking rewards, ETH and SOL had no negative returns across all five-year holding periods; in the worst case, BTC lost about 13%. The BTC five-year median return is above 8x, while the ETH five-year median return is close to 13x.
Methodology and data scope
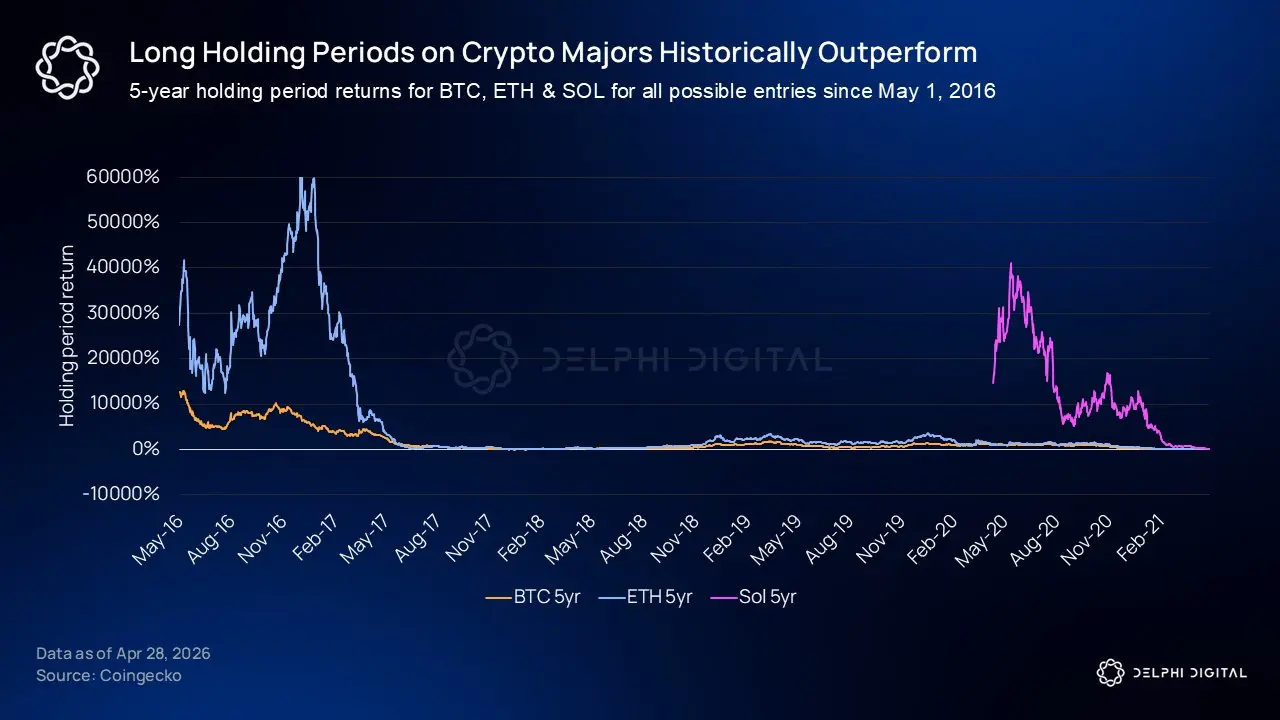
(Source: Delphi Digital)
According to Delphi Digital’s April 30 post on the X platform, the analysis was led by the firm’s analyst @yeak__, and it performs a comprehensive backtest of all possible five-year holding periods for BTC, ETH, and SOL using daily price data starting from May 2016. The return calculations for ETH and SOL include the applicable staking rewards for each.
Key backtest results
According to the analysis released by Delphi Digital on April 30, the backtest results for each asset are as follows:
· For BTC, out of all five-year holding periods, only 11 intervals showed negative returns. The worst entry point was December 16, 2017 (close to the top of the prior market cycle); it exited about at the bottom of the 2022 cycle after five years, with a return of roughly -13%. The BTC five-year holding period median return exceeds 8x.
· After including their respective staking rewards, ETH and SOL showed no negative returns across all five-year holding periods. The ETH five-year holding period median return is close to 13x.
Delphi Digital also noted that shorter holding periods are more sensitive to entry price; using the most unfavorable holding period as the baseline only reflects data from a small number of exceptional windows within the historical sample.
Comparison with traditional assets
Based on Delphi Digital’s April 30 analysis, Nvidia (NVDA)’s cumulative price increase over the past five years is about 14x, and it is often used as a benchmark for comparison with cryptocurrencies. Delphi Digital pointed out that this figure is close to the third and fourth quartile (Q3) of BTC and ETH’s historical five-year return distribution, rather than representing the highest historical return range for those two assets.
Frequently asked questions
Which assets does Delphi Digital’s five-year holding period backtest cover?
According to the analysis Delphi Digital published on X on April 30, the backtest covers BTC, ETH, and SOL; the data scope is daily prices starting from May 2016, and the return calculations for ETH and SOL include the applicable staking rewards.
What is BTC’s worst performance over a five-year holding period?
According to Delphi Digital’s April 30 analysis, BTC’s worst entry point was December 16, 2017 (close to the top of the prior cycle). It exited at a point close to the end-2022 bottom after five years, with a return of about -13%; across all holding periods, only 11 intervals had negative returns.
How do Nvidia’s five-year returns relate to the historical performance of BTC and ETH?
According to Delphi Digital’s April 30 analysis, Nvidia (NVDA)’s cumulative price increase over the past five years is about 14x, which is close to the third quartile (Q3) of the historical five-year return distribution for BTC and ETH, rather than representing the highest historical return range for those two assets.

