

#BTC
Perspectiva del Mercado de Bitcoin en Junio 2026 — Presión Macroeconómica, Ciclo de Liquidez y Estructura de Precios
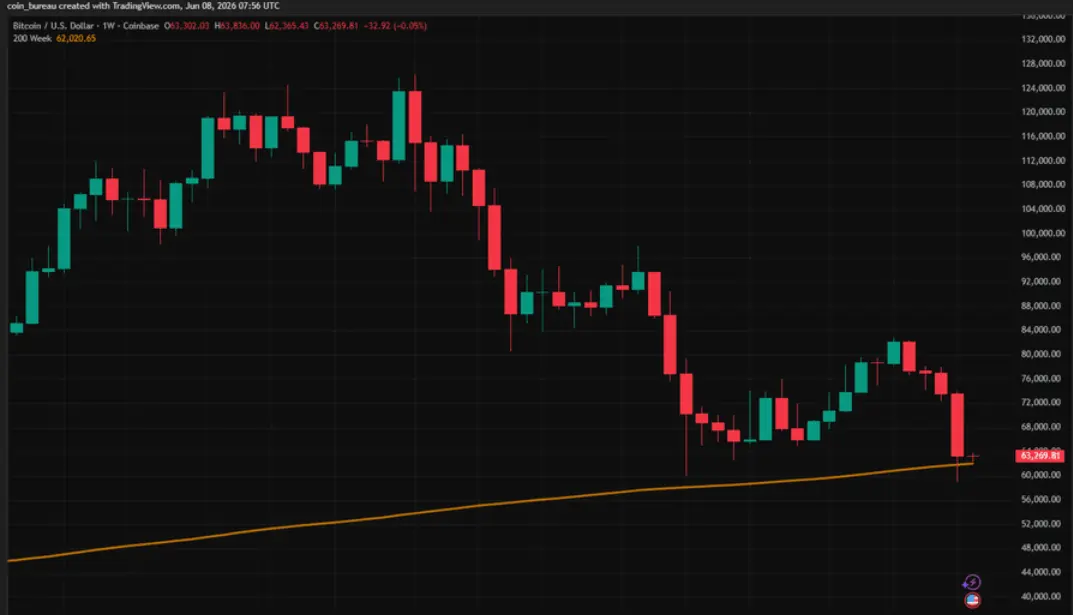
La fase actual de Bitcoin muestra una transición clara de un impulso especulativo hacia un entorno de contracción de liquidez impulsado por factores macroeconómicos, donde el comportamiento del precio está cada vez más influenciado por el endurecimiento financiero global en lugar de catalizadores nativos del cripto. Al 8 de junio de 2026, Bitcoin cotiza aproximadamente a $63,500 USDT, reflejando la volatilidad reciente tras una corrección aguda de casi un 20% desde su pico reciente. Este tipo de movimiento de precios indica que el mercado ya no está en una fase de expansión alcista pura, sino que opera dentro de una zona de equilibrio altamente sensible, donde tanto las recuperaciones al alza como las caídas pronunciadas dependen en gran medida de las condiciones de liquidez y la participación institucional.
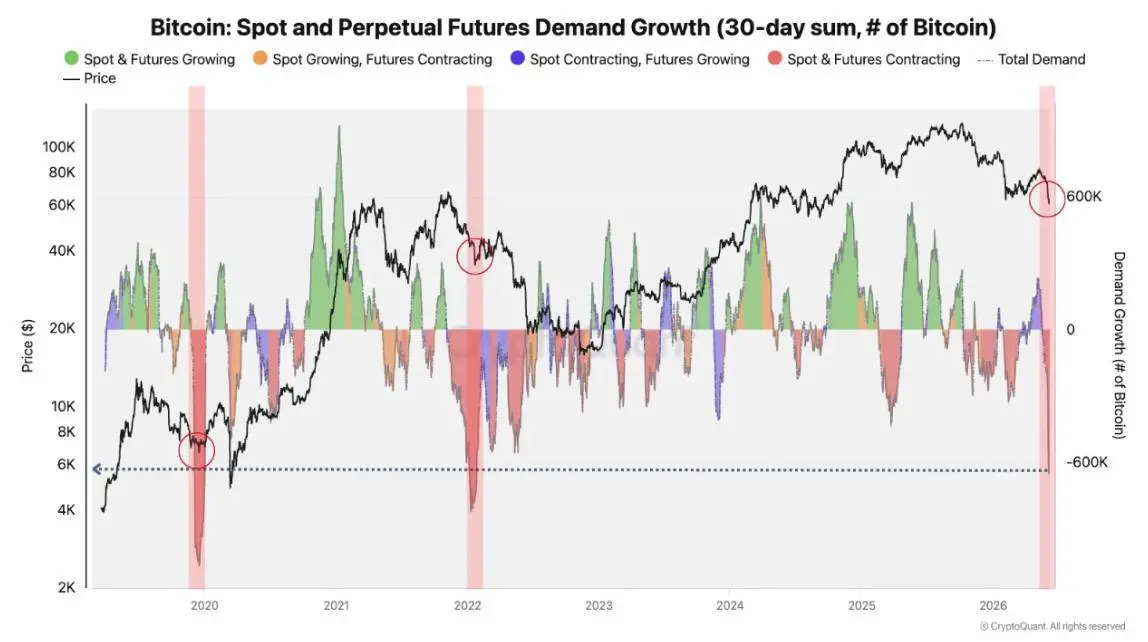
Lo que hace que la estructura actual sea particularmente importante es el dominio de las fuerzas macroeconómicas sobre los fundamentos en cadena. Datos laborales sólidos en EE. UU., el aumento en los rendimientos del Tesoro y un dólar estadounidense fortalecido han creado colectivamente una resistencia para los activos de riesgo, llevando a los inversores a reducir su exposición a instrumentos volátiles como Bitcoin. Al mismo tiempo, las salidas consecutivas de ETF sugieren que el capital institucional está rotando activamente fuera de las criptomonedas y hacia sectores percibidos como más estables o más inmediatamente rentables, particularmente acciones impulsadas por IA y infraestructuras tecnológicas tradicionales. Esta rotación ha debilitado el soporte estructural detrás de los intentos de rally de Bitcoin, haciendo que cada rebote sea más frágil y menos sostenible a menos que cuente con nuevas entradas de capital.
Desde una perspectiva de sentimiento, el mercado se encuentra actualmente en una fase dominada por el miedo pero reactiva, donde los traders responden de manera agresiva a las señales macro en lugar de tener convicción a largo plazo. Aunque Bitcoin ha logrado estabilizarse por encima de niveles psicológicos clave tras su reciente caída, la falta de entradas constantes significa que la recuperación carece de profundidad. Esto crea un entorno de mercado donde los rallies a menudo se interpretan como alivios temporales en lugar de reversals estructurales. La introducción de instrumentos enfocados en la volatilidad, como los futuros de volatilidad de Bitcoin de CME, también destaca cómo los actores institucionales se están adaptando a este régimen, tratando a Bitcoin cada vez más como un activo de volatilidad negociable en lugar de un activo de crecimiento direccional.
Técnicamente, Bitcoin permanece en un amplio rango de consolidación con volatilidad elevada, donde los bolsillos de liquidez por encima y por debajo de los niveles de precio actuales son constantemente probados. En tales condiciones, la dirección del precio se vuelve menos predecible y más dependiente de catalizadores macro externos como datos de inflación, expectativas de tasas de interés y reversiones en los flujos de ETF. El desencadenante alcista clave sería un retorno sostenido de entradas institucionales combinado con un debilitamiento del dólar, lo que podría restaurar el impulso y reintroducir dinámicas de continuación de tendencia. Sin estas condiciones, el mercado corre el riesgo de permanecer atrapado en una estructura de rango y choppy, con rupturas falsas frecuentes y reversiones impulsadas por liquidez.
Desde una perspectiva estratégica, este entorno exige un enfoque disciplinado y defensivo en lugar de una posición apalancada agresiva. El factor más importante no es perseguir movimientos a corto plazo, sino entender los ciclos de liquidez y la alineación macroeconómica. Bitcoin actúa actualmente como un indicador de apetito global por el riesgo, lo que significa que su precio refleja la confianza más amplia de los inversores en las condiciones de liquidez en lugar de fundamentos cripto aislados. En este sentido, el mercado actual se trata menos de predicción y más de temporizar la exposición en torno a puntos de inflexión macroeconómicos.
En general, la perspectiva de Bitcoin para junio de 2026 está definida por la incertidumbre macro, la hesitación institucional y los frágiles intentos de recuperación de liquidez, con la estabilidad del precio altamente dependiente de las condiciones financieras externas. Hasta que ocurra un cambio claro en la dirección de la liquidez, la volatilidad permanecerá elevada y la convicción direccional seguirá limitada.
Perspectiva del Mercado de Bitcoin en Junio 2026 — Presión Macroeconómica, Ciclo de Liquidez y Estructura de Precios
La fase actual de Bitcoin muestra una transición clara de un impulso especulativo hacia un entorno de contracción de liquidez impulsado por factores macroeconómicos, donde el comportamiento del precio está cada vez más influenciado por el endurecimiento financiero global en lugar de catalizadores nativos del cripto. Al 8 de junio de 2026, Bitcoin cotiza aproximadamente a $63,500 USDT, reflejando la volatilidad reciente tras una corrección aguda de casi un 20% desde su pico reciente. Este tipo de movimiento de precios indica que el mercado ya no está en una fase de expansión alcista pura, sino que opera dentro de una zona de equilibrio altamente sensible, donde tanto las recuperaciones al alza como las caídas pronunciadas dependen en gran medida de las condiciones de liquidez y la participación institucional.
Lo que hace que la estructura actual sea particularmente importante es el dominio de las fuerzas macroeconómicas sobre los fundamentos en cadena. Datos laborales sólidos en EE. UU., el aumento en los rendimientos del Tesoro y un dólar estadounidense fortalecido han creado colectivamente una resistencia para los activos de riesgo, llevando a los inversores a reducir su exposición a instrumentos volátiles como Bitcoin. Al mismo tiempo, las salidas consecutivas de ETF sugieren que el capital institucional está rotando activamente fuera de las criptomonedas y hacia sectores percibidos como más estables o más inmediatamente rentables, particularmente acciones impulsadas por IA y infraestructuras tecnológicas tradicionales. Esta rotación ha debilitado el soporte estructural detrás de los intentos de rally de Bitcoin, haciendo que cada rebote sea más frágil y menos sostenible a menos que cuente con nuevas entradas de capital.
Desde una perspectiva de sentimiento, el mercado se encuentra actualmente en una fase dominada por el miedo pero reactiva, donde los traders responden de manera agresiva a las señales macro en lugar de tener convicción a largo plazo. Aunque Bitcoin ha logrado estabilizarse por encima de niveles psicológicos clave tras su reciente caída, la falta de entradas constantes significa que la recuperación carece de profundidad. Esto crea un entorno de mercado donde los rallies a menudo se interpretan como alivios temporales en lugar de reversals estructurales. La introducción de instrumentos enfocados en la volatilidad, como los futuros de volatilidad de Bitcoin de CME, también destaca cómo los actores institucionales se están adaptando a este régimen, tratando a Bitcoin cada vez más como un activo de volatilidad negociable en lugar de un activo de crecimiento direccional.
Técnicamente, Bitcoin permanece en un amplio rango de consolidación con volatilidad elevada, donde los bolsillos de liquidez por encima y por debajo de los niveles de precio actuales son constantemente probados. En tales condiciones, la dirección del precio se vuelve menos predecible y más dependiente de catalizadores macro externos como datos de inflación, expectativas de tasas de interés y reversiones en los flujos de ETF. El desencadenante alcista clave sería un retorno sostenido de entradas institucionales combinado con un debilitamiento del dólar, lo que podría restaurar el impulso y reintroducir dinámicas de continuación de tendencia. Sin estas condiciones, el mercado corre el riesgo de permanecer atrapado en una estructura de rango y choppy, con rupturas falsas frecuentes y reversiones impulsadas por liquidez.
Desde una perspectiva estratégica, este entorno exige un enfoque disciplinado y defensivo en lugar de una posición apalancada agresiva. El factor más importante no es perseguir movimientos a corto plazo, sino entender los ciclos de liquidez y la alineación macroeconómica. Bitcoin actúa actualmente como un indicador de apetito global por el riesgo, lo que significa que su precio refleja la confianza más amplia de los inversores en las condiciones de liquidez en lugar de fundamentos cripto aislados. En este sentido, el mercado actual se trata menos de predicción y más de temporizar la exposición en torno a puntos de inflexión macroeconómicos.
En general, la perspectiva de Bitcoin para junio de 2026 está definida por la incertidumbre macro, la hesitación institucional y los frágiles intentos de recuperación de liquidez, con la estabilidad del precio altamente dependiente de las condiciones financieras externas. Hasta que ocurra un cambio claro en la dirección de la liquidez, la volatilidad permanecerá elevada y la convicción direccional seguirá limitada.