# 2025 SAI Price Prediction: Expert Analysis and Market Outlook for the Upcoming Year
**Article Overview**
This comprehensive guide analyzes Sharpe AI (SAI) token dynamics through 2031, combining historical price patterns, market supply metrics, and macroeconomic factors to deliver professional forecasts. The article addresses investor concerns about SAI's extreme volatility (-95.58% decline), current market position ($0.002376), and concentrated holder distribution while providing actionable investment strategies tailored to different investor profiles. Readers gain clarity on SAI's market sentiment (Extreme Fear Index: 20), structural risks including limited liquidity and regulatory uncertainties, and evidence-based trading methodologies via Gate platform access. Whether you're a beginner, experienced trader, or institutional investor, this report delivers critical data for informed decision-making in this speculative AI trading automation sector, with price projections ranging from $0.00202 to $0.00589 t
Introduction: Market Position and Investment Value of SAI
Sharpe AI (SAI) is an AI-powered crypto super-app designed for professional traders, offering a unified platform for intelligence, investing, and automating digital assets. As of January 1, 2026, SAI has established itself in the digital asset ecosystem with a market capitalization of $229,678.416 and a circulating supply of approximately 96,666,000 tokens, with prices currently trading around $0.002376.
This innovative platform is playing an increasingly important role in providing intelligent solutions for professional traders and digital asset management across the market.
This article will comprehensively analyze SAI's price trends through 2031, combining historical patterns, market supply and demand dynamics, ecosystem development, and macroeconomic factors to provide investors with professional price forecasts and practical investment strategies.
Sharpe AI (SAI) Market Analysis Report
I. SAI Price History Review and Market Status
SAI Historical Price Trajectory
-
August 2024: Token launch phase, SAI reached its all-time low of $0.00215 on August 27, 2024, marking the beginning of its market presence.
-
January 2025: Peak performance period, SAI achieved its all-time high of $0.11866 on January 17, 2025, representing a significant appreciation phase for early adopters.
-
2025-2026: Market correction phase, SAI experienced substantial pullback from peak levels, declining approximately 95.58% over the one-year period.
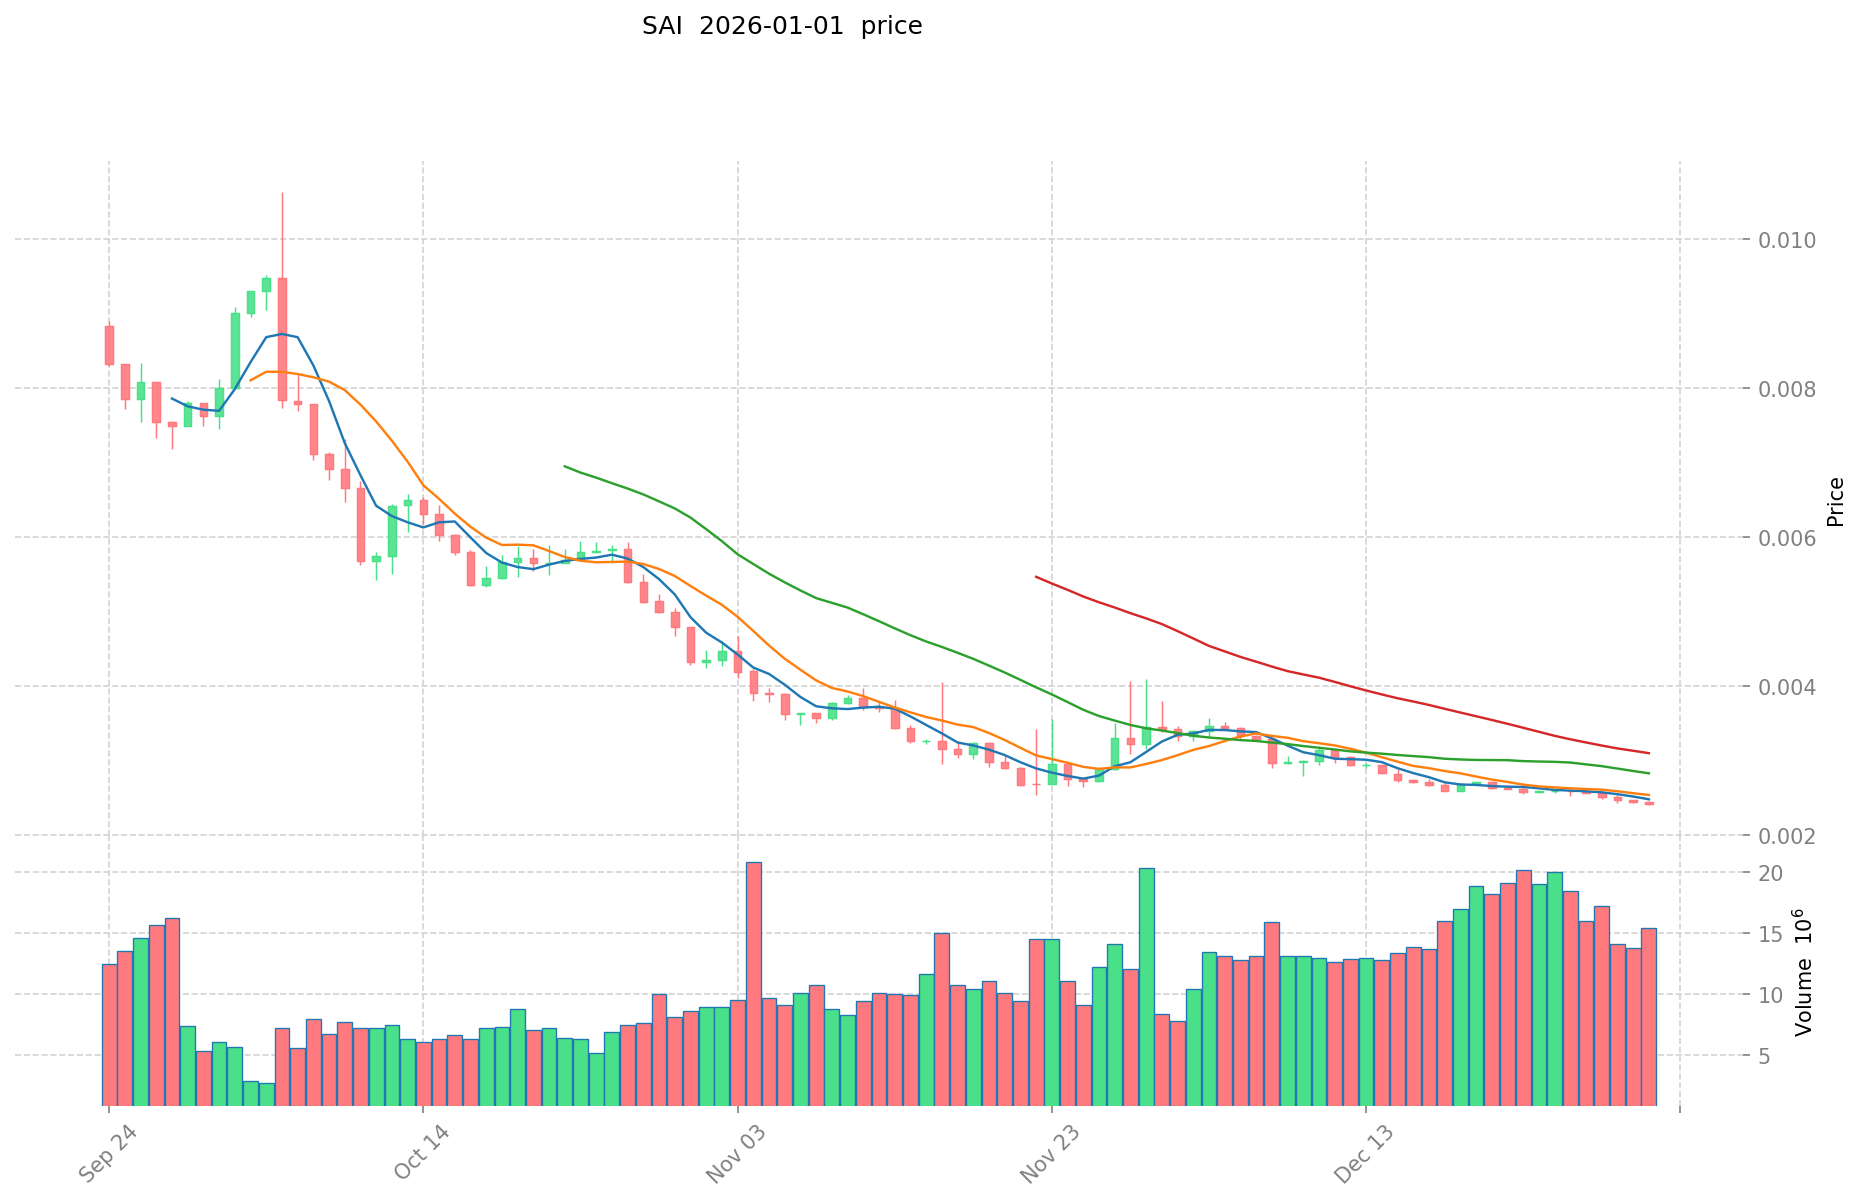
SAI Current Market Conditions
As of January 1, 2026, SAI is trading at $0.002376, reflecting a 24-hour price decline of 2.61%. The token demonstrates the following market metrics:
- 24-hour trading range: $0.002351 to $0.002453
- 24-hour trading volume: $39,643.23
- Market capitalization: $229,678.42
- Fully diluted valuation: $2,376,000.00
- Circulating supply: 96,666,000 SAI (9.67% of total supply)
- Total supply: 1,000,000,000 SAI
- Token holders: 7,859 addresses
- Market ranking: #3,995
The 7-day price change stands at -8.26%, while the 30-day performance shows a -28.27% decline. Over the past hour, SAI declined by 0.29%. The token maintains a market dominance of 0.000075%, indicating its minimal share in the broader cryptocurrency market.
Current market sentiment reflects extreme fear conditions with a VIX score of 20, suggesting heightened volatility and risk aversion across digital asset markets.
Click to view current SAI market price
SAI Market Sentiment Indicator
2026-01-01 Fear and Greed Index: 20 (Extreme Fear)
Click to view current Fear & Greed Index
The cryptocurrency market is currently experiencing extreme fear, with the Fear and Greed Index at 20. This exceptionally low reading suggests widespread investor anxiety and pessimism across digital assets. During periods of extreme fear, markets often reach capitulation lows, creating potential buying opportunities for contrarian investors. However, heightened caution remains warranted. Monitor market fundamentals closely and consider dollar-cost averaging strategies rather than lump-sum investments. On Gate.com, you can track real-time market sentiment and access comprehensive trading tools to navigate volatile market conditions effectively.

SAI Holdings Distribution
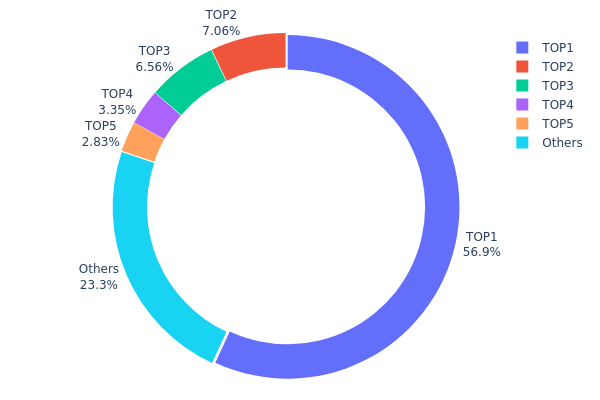
The address holdings distribution chart illustrates the concentration of SAI tokens across blockchain addresses, revealing the degree of decentralization and potential market risk factors. Each address represents a unique holder entity, and the percentage distribution indicates the proportion of total token supply held by top addresses compared to the broader holder base.
SAI exhibits pronounced concentration characteristics, with the top holder commanding 56.92% of total token supply—a substantially elevated figure that indicates significant centralization risk. The combined holdings of the top five addresses account for 76.71% of all SAI tokens in circulation, while the remaining 23.29% is distributed across other addresses. This distribution pattern demonstrates extreme concentration, where a single entity maintains majority control over the asset. Such structural imbalance creates considerable vulnerability, as the primary address holder possesses sufficient tokens to substantially influence market dynamics and token supply mechanics.
The concentrated address distribution poses material implications for market structure and stability. The dominant position of the top holder creates asymmetric market conditions where large-scale token movements could trigger significant price volatility and liquidity disruptions. Additionally, the high concentration level constrains organic market development and reduces the resilience of the broader ecosystem. From a decentralization standpoint, SAI currently reflects limited distribution maturity, suggesting the token supply remains substantially dependent on a small number of key stakeholders. This concentration profile indicates that SAI's on-chain structure lacks the distributed foundation typically associated with robust, long-term market stability, thereby presenting notable structural risks to the broader holder community.
Click to view the current SAI holdings distribution
| Top |
Address |
Holding Qty |
Holding (%) |
| 1 |
0x9a18...a6600a |
569257.27K |
56.92% |
| 2 |
0x648b...657a19 |
70618.49K |
7.06% |
| 3 |
0x75e8...1dcb88 |
65553.48K |
6.55% |
| 4 |
0xec0f...cb6cba |
33524.92K |
3.35% |
| 5 |
0x1f9b...a7d257 |
28341.83K |
2.83% |
| - |
Others |
232704.01K |
23.29% |
Core Factors Influencing SAI's Future Price
Supply Mechanism
-
AI-Driven Data Storage Demand: The current surge in storage prices is primarily driven by robust procurement demand from AI computing infrastructure. As noted by industry observers, this round of storage price increases stems from strong purchasing demand from AI algorithm computing infrastructure and manufacturers' capacity shift toward high-end storage solutions. This structural demand is expected to sustain momentum as AI deployment accelerates globally.
-
Historical Pattern: AI-driven infrastructure investment cycles have historically supported storage and semiconductor valuations during technology adoption phases. The current cycle shows parallels to previous computing infrastructure expansions, with demand-side strength translating to pricing power.
-
Current Impact: With AI driving sustained demand for data storage infrastructure, SAI-related assets benefit from this structural tailwind. Continued growth in AI workloads and data processing requirements should maintain upward pressure on storage demand and pricing.
Macroeconomic Environment
-
Monetary Policy Influence: The Federal Reserve has implemented cumulative rate cuts of 175 basis points through December 2025, with the federal funds rate now at 3.50%-3.75%. Market data indicates a greater than 83% probability of a 25 basis point rate cut in June 2026, and over 68% probability of continued cuts through year-end 2026. This prolonged easing cycle supports risk asset valuations and growth-oriented technology investments.
-
Inflation Hedge Properties: In the current macroeconomic environment characterized by fiscal expansion and monetary accommodation, infrastructure assets like storage demonstrate defensive characteristics. The substantial U.S. fiscal expansion (with deficit increases projected at approximately $4.1 trillion over ten years) creates demand for real productive assets and infrastructure investments.
-
Geopolitical Factors: Global trade tensions and supply chain concerns have elevated the strategic importance of domestic semiconductor and storage capacity. Efforts to reduce reliance on concentrated supply sources are driving investment in distributed storage and computing infrastructure across multiple jurisdictions.
Technology Development and Ecosystem Building
-
AI Infrastructure Investment: The global semiconductor market is projected to reach approximately $9.75 trillion in 2026, representing over 26% year-on-year growth. China's semiconductor exports have maintained above 20% year-on-year growth for eight consecutive months, with cumulative export volumes exceeding $1.8 billion. This expansion in AI-capable computing infrastructure directly supports demand for advanced storage solutions.
-
Data Center Proliferation: Major technology companies are maintaining elevated capital expenditure on AI infrastructure through 2027. While market focus is shifting from capital outlays to return on investment, the absolute magnitude of infrastructure deployment continues to expand, supporting sustained demand for storage systems and related components.
-
Ecosystem Applications: The development of edge AI and endpoint computing requires distributed storage architecture, creating demand across multiple market segments rather than concentrated in traditional data center environments. This diversification of storage demand across edge, cloud, and hybrid deployments supports broader market adoption.
Three, 2026-2031 SAI Price Forecast
2026 Outlook
- Conservative Forecast: $0.00202 - $0.00238
- Neutral Forecast: $0.00238 - $0.00285
- Optimistic Forecast: $0.00333 (requiring sustained market recovery and increased institutional adoption)
2027-2029 Medium-term Outlook
- Market Phase Expectations: Gradual recovery and accumulation phase with potential momentum building toward mid-cycle expansion
- Price Range Predictions:
- 2027: $0.00194 - $0.00356 (20% upside potential)
- 2028: $0.00215 - $0.00414 (35% growth trajectory)
- 2029: $0.00345 - $0.00544 (54% expansion phase)
- Key Catalysts: Ecosystem development initiatives, increased DeFi protocol integration, market sentiment improvement, and potential regulatory clarity in major jurisdictions
2030-2031 Long-term Outlook
- Base Case Scenario: $0.00314 - $0.00578 (assumes steady technological advancement and moderate market adoption)
- Optimistic Scenario: $0.00486 - $0.00589 (assumes accelerated protocol upgrades and broader institutional participation)
- Transformative Scenario: $0.00589+ (extreme favorable conditions including mainstream adoption, major strategic partnerships, and significant on-chain activity growth)
- 2031-12-31: SAI $0.00589 (potential long-term resistance level based on cumulative 117% appreciation from 2026)
| 年份 |
预测最高价 |
预测平均价格 |
预测最低价 |
涨跌幅 |
| 2026 |
0.00333 |
0.00238 |
0.00202 |
0 |
| 2027 |
0.00356 |
0.00285 |
0.00194 |
20 |
| 2028 |
0.00414 |
0.00321 |
0.00215 |
35 |
| 2029 |
0.00544 |
0.00367 |
0.00345 |
54 |
| 2030 |
0.00578 |
0.00455 |
0.00314 |
91 |
| 2031 |
0.00589 |
0.00517 |
0.00486 |
117 |
Sharpe AI (SAI) Professional Investment Strategy and Risk Management Report
IV. SAI Professional Investment Strategy and Risk Management
SAI Investment Methodology
(1) Long-term Holding Strategy
- Target Investors: Institutional investors and professional traders who believe in AI-powered trading automation technology
- Operational Recommendations:
- Accumulate SAI during market downturns when volatility presents entry opportunities, given the token's historical price recovery patterns
- Establish a diversified portfolio position with SAI representing no more than 5-10% of total crypto holdings
- Monitor platform adoption metrics and user growth as key performance indicators for long-term value appreciation
(2) Active Trading Strategy
- Technical Analysis Tools:
- Support and Resistance Levels: Identify key price zones around $0.002351 (24H low) and $0.002453 (24H high) for entry and exit points
- Volatility Indicators: Utilize moving averages to track 24-hour price momentum and identify reversal patterns in SAI trading pairs
- Wave Trading Key Points:
- Execute buy orders during negative price movement cycles (recent 24H decline of -2.61%) when technical oversold conditions appear
- Set profit-taking targets at 15-20% gains above entry points, considering SAI's recent volatility profile
SAI Risk Management Framework
(1) Asset Allocation Principles
- Conservative Investors: 1-2% of total crypto portfolio allocation
- Active Investors: 3-5% of total crypto portfolio allocation
- Professional Traders: 5-10% of total crypto portfolio allocation, with active hedging strategies
(2) Risk Hedging Solutions
- Stablecoin Hedging: Maintain 30-40% of SAI position value in stablecoins to protect against extreme downside volatility
- Portfolio Diversification: Balance SAI holdings with established large-cap cryptocurrencies to reduce concentration risk exposure
(3) Secure Storage Solutions
- Hot Wallet Management: Use Gate.com platform's native wallet functionality for active trading and frequent transactions
- Self-Custody Security: Store significant SAI holdings through hardware wallet solutions for long-term security with full custody control
- Security Considerations: Enable two-factor authentication on Gate.com accounts; never share private keys or seed phrases; verify contract addresses before transfers; conduct regular security audits of wallet holdings
V. SAI Potential Risks and Challenges
SAI Market Risk
- High Volatility Exposure: SAI has experienced a -95.58% decline over the past year, indicating extreme price instability and unpredictable market conditions that can result in substantial investor losses
- Liquidity Constraints: With only $39,643 in 24-hour trading volume and 7,859 token holders, limited market liquidity may impact the ability to execute large trades without significant price slippage
- Market Sentiment Deterioration: Current market emotion indicator reflects negative sentiment, suggesting reduced institutional and retail investor confidence in the project's near-term prospects
SAI Regulatory Risk
- Evolving Compliance Environment: AI-powered trading tools may face increased scrutiny from financial regulators regarding automated trading practices and market manipulation prevention
- Token Classification Uncertainty: Regulatory status of utility tokens in major jurisdictions remains ambiguous, creating potential legal complications for exchanges and investors
- Geographic Restrictions: Certain jurisdictions may impose trading restrictions or delisting requirements affecting SAI's availability on trading platforms
SAI Technology Risk
- Smart Contract Vulnerabilities: As an ERC-20 token on Ethereum, SAI depends on both token contract security and underlying blockchain network stability
- Platform Development Execution: Success depends on Sharpe AI's ability to deliver promised features and maintain competitive advantage in crowded AI trading application market
- Ecosystem Adoption: Limited exchange availability (currently listed on 1 exchange) restricts accessibility and may constrain user growth and platform network effects
VI. Conclusions and Action Recommendations
SAI Investment Value Assessment
Sharpe AI represents a speculative investment opportunity in the AI-powered trading automation sector. While the platform's core concept targets professional traders with legitimate product-market demand, the token's current metrics present significant concerns. The -95.58% year-over-year decline, minimal market capitalization of $229,678, and concentrated holder base suggest substantial downside risks alongside limited institutional validation. The project shows early-stage characteristics requiring careful monitoring before substantial investment commitment.
SAI Investment Recommendations
✅ Beginners: Avoid direct SAI investment; focus on understanding AI trading applications and platform fundamentals before considering participation; consider learning through demo trading environments
✅ Experienced Investors: Limit SAI allocation to 1-3% of total portfolio as a speculative position; conduct thorough due diligence on platform development progress, partnership announcements, and user adoption metrics; establish strict stop-loss orders at 20-25% below entry points
✅ Institutional Investors: Consider minimal exposure pending significant platform development milestones; require verified user adoption data, partnership announcements with major institutional traders, and audited smart contract security assessments before meaningful allocation
SAI Trading Participation Methods
- Gate.com Trading: Access SAI trading pairs directly through Gate.com's exchange platform with integrated order management and real-time market data
- Contract Interaction: Advanced users can interact directly with SAI smart contract (0x3567aa22cd3ab9aef23d7e18ee0d7cf16974d7e6) on Ethereum blockchain via etherscan.io verification
- Platform Native Integration: Monitor Sharpe AI official platform at sharpe.ai for direct token utility features, staking opportunities, and platform-native trading mechanisms
Cryptocurrency investment carries extreme risk. This report does not constitute investment advice. Investors must make decisions based on individual risk tolerance and are strongly advised to consult professional financial advisors. Never invest funds you cannot afford to lose completely.
FAQ
What is SAI and what is its current market price?
SAI is a decentralized stablecoin within the MakerDAO ecosystem. Its current market price is $15.63, with a market cap of $41.723 million and 24-hour trading volume of $2.81 million.
What factors influence SAI token price movements?
SAI token price is influenced by trading volume, market sentiment, cryptocurrency market trends, and project news updates. Supply-demand dynamics and broader market conditions also play significant roles in price fluctuations.
How can I predict SAI price using technical analysis?
To predict SAI price using technical analysis, analyze chart patterns, moving averages, and trading volume trends. These indicators help identify price movements and market momentum for more accurate forecasting.
What are the risks and volatility factors for SAI price prediction?
SAI price volatility is driven by market sentiment, trading volume fluctuations, and external economic factors. Historical data shows 5.28% volatility over the last month with 37% green days, indicating moderate price swings influenced by broader crypto market dynamics and investor behavior.
How does SAI price compare to other stablecoins or similar tokens?
SAI trades at $15.61, significantly higher than traditional stablecoins around $1. SAI has reached an all-time high of $25.84, demonstrating substantial price appreciation compared to standard stablecoin models.
What is the long-term price forecast for SAI in the next 6-12 months?
SAI is projected to decline 18.06% over the next 6-12 months, reaching approximately $0.002027 by June 2026, based on current market trend analysis and technical indicators.
* The information is not intended to be and does not constitute financial advice or any other recommendation of any sort offered or endorsed by Gate.