# Article Introduction
This comprehensive TMAI price analysis examines Token Metrics AI's market position, historical performance, and price forecasts through 2030. The report addresses investment decisions across all experience levels—from beginners to institutional investors—by analyzing current market metrics, holdings distribution, and risk-management strategies. Structured across market analysis, price predictions, and professional investment frameworks, the article provides actionable insights for navigating TMAI's extreme volatility and growth potential. Discover accumulation opportunities, trading methodologies, and essential risk controls while exploring TMAI's AI-powered trading bot utility on Gate. This guide equips crypto investors with data-driven forecasts and strategic recommendations for capitalizing on emerging AI token opportunities.
Introduction: TMAI's Market Position and Investment Value
Token Metrics AI (TMAI) is a groundbreaking token designed to empower the crypto community with unmatched AI tools and insights. Since its launch in December 2024, TMAI has established itself as an innovative solution in the cryptocurrency ecosystem. As of December 28, 2025, TMAI boasts a market capitalization of approximately $864,690.79, with a circulating supply of around 8.10 billion tokens, trading at approximately $0.0001068 per token. This pioneering asset, recognized for its AI-powered trading bot capabilities compatible with both centralized and decentralized exchanges, is playing an increasingly vital role in automated trading strategy execution and market analysis.
This article will comprehensively analyze TMAI's price trajectory through 2030, incorporating historical patterns, market supply-demand dynamics, ecosystem development, and macroeconomic factors to provide investors with professional price forecasts and actionable investment strategies.
Token Metrics AI (TMAI) Market Analysis Report
I. TMAI Price History Review and Current Market Status
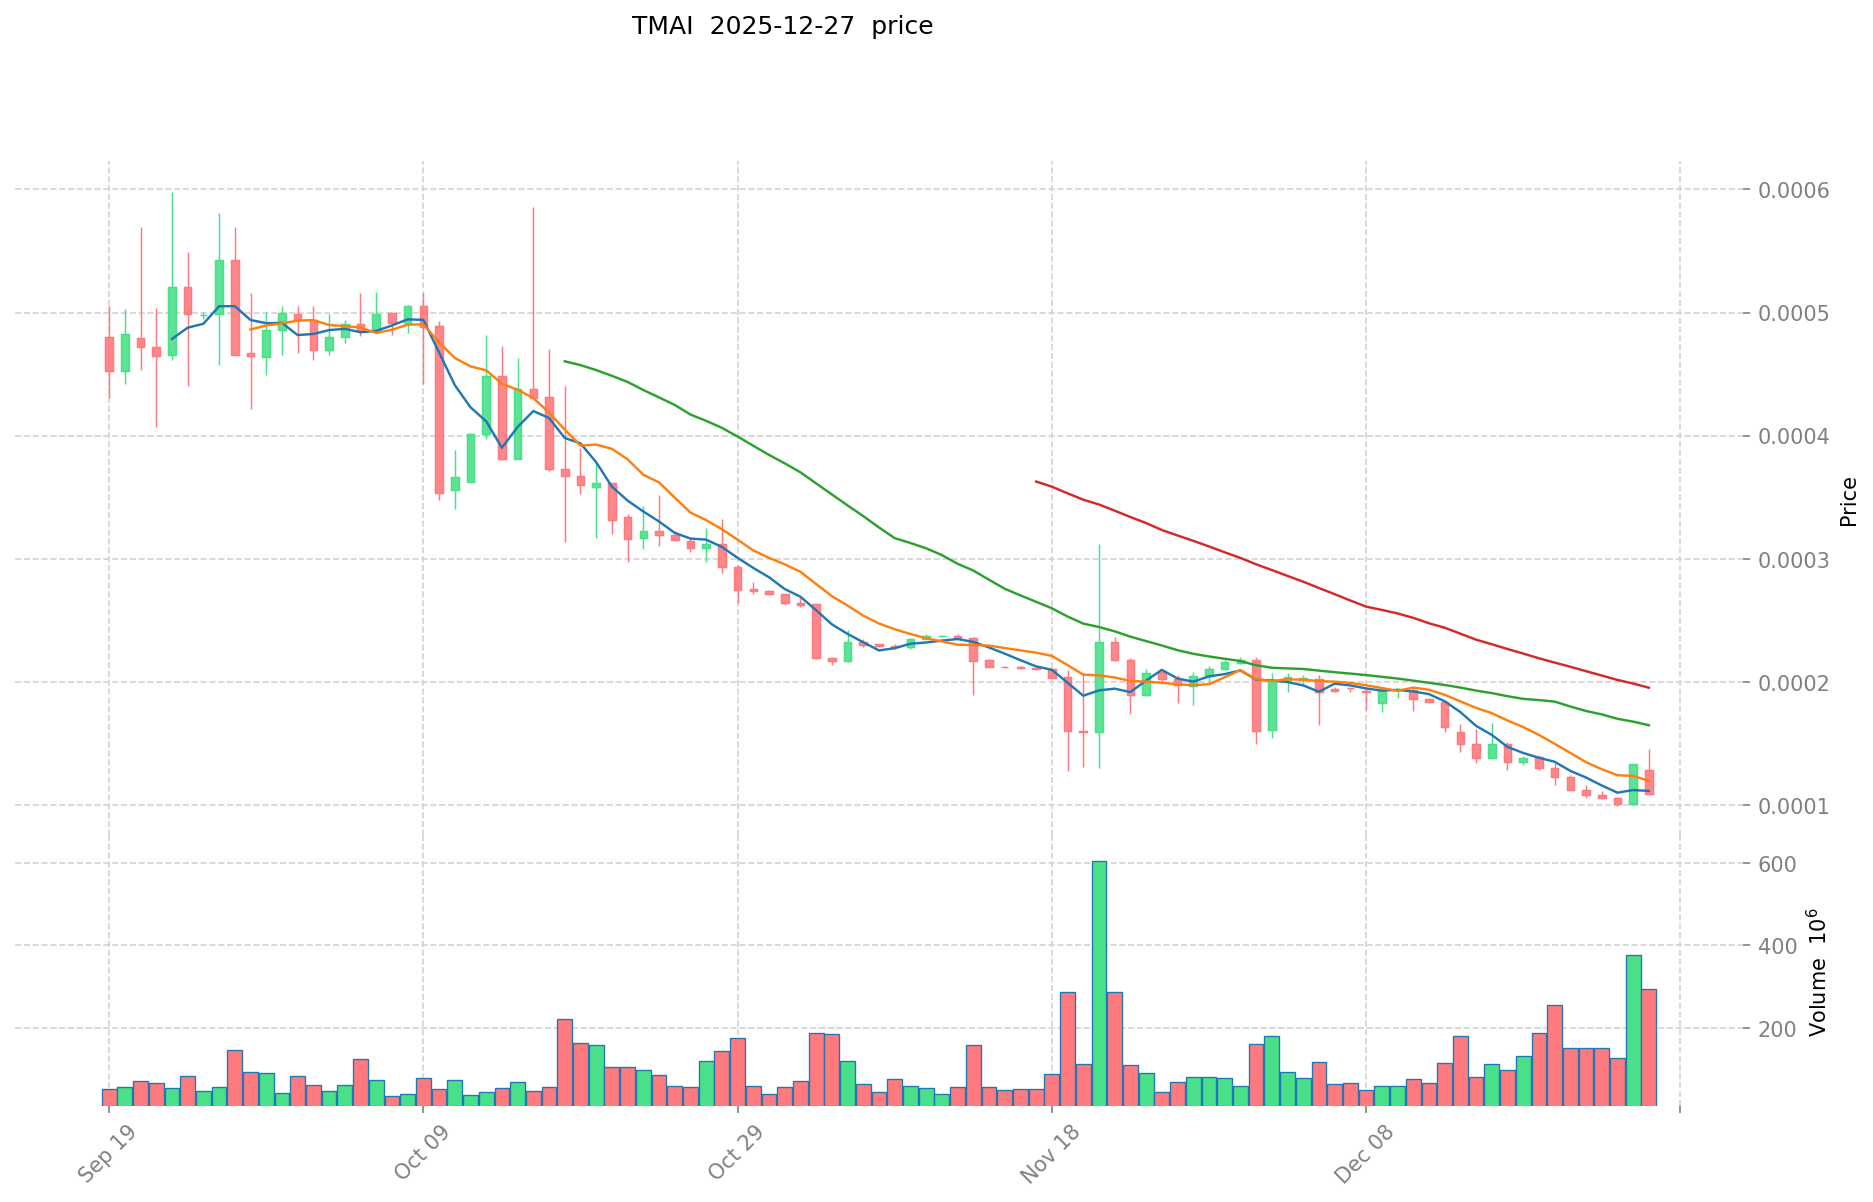
TMAI Historical Price Evolution
- December 2024: Token launched on BASE chain, reaching all-time high of $0.017747 on December 17, 2024
- Late December 2024 to Present: Significant price correction, declining from peak levels to current trading range
TMAI Current Market Situation
As of December 28, 2025, Token Metrics AI (TMAI) is trading at $0.0001068, reflecting substantial downward pressure from its historical peak. The token has experienced a -3.17% decline over the last 24 hours and a more pronounced -12.82% drop over the past 7 days.
Over the 30-day period, TMAI has depreciated by -48.16%, while the one-year performance shows an extreme -98.54% decline from its launch price. The 24-hour trading range spans from $0.0001046 to $0.0001109, indicating relatively tight price action despite the severe long-term downtrend.
Key Market Metrics:
- Current Market Capitalization: $864,690.79
- Fully Diluted Valuation: $1,068,000.00
- 24-Hour Trading Volume: $15,599.28
- Circulating Supply: 8,096,355,748 TMAI (80.96% of total supply)
- Total Supply: 10,000,000,000 TMAI
- Number of Holders: 75,520
- Market Ranking: #2,742
The token maintains a market share of 0.000033% within the broader cryptocurrency ecosystem. TMAI is currently listed on 2 exchanges and demonstrates a circulating-to-fully-diluted valuation ratio of 80.96%, indicating moderate inflation dynamics from remaining unlocked tokens.
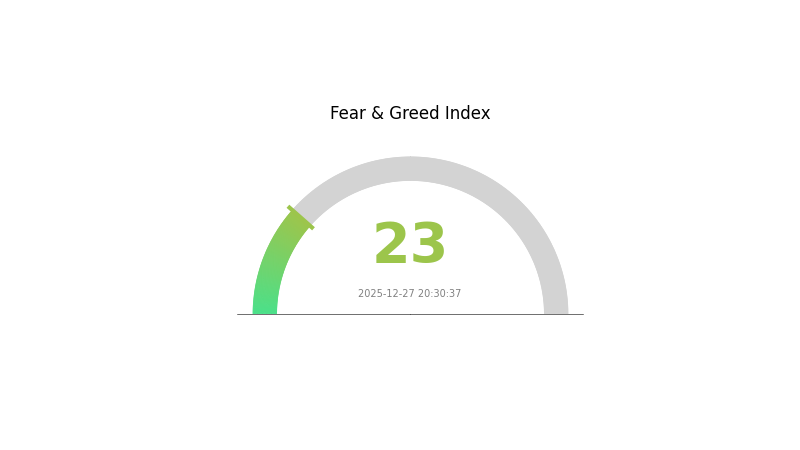
Current market sentiment reflects "Extreme Fear" (VIX: 23 as of December 27, 2025), suggesting heightened risk aversion across the cryptocurrency market environment.
Click to view current TMAI market price
TMAI Market Sentiment Index
2025-12-27 Fear and Greed Index: 23 (Extreme Fear)
Click to view current Fear & Greed Index
The cryptocurrency market is experiencing extreme fear, with the Fear and Greed Index plummeting to 23. This reading indicates significant market pessimism and investor anxiety, driven by recent market volatility and negative sentiment. During periods of extreme fear, experienced traders often view it as a potential buying opportunity, as assets may be oversold. However, caution is advised when entering the market. Monitor key support levels and manage risk carefully. On Gate.com, you can track real-time market sentiment data and make informed investment decisions based on comprehensive market analysis and indicators.
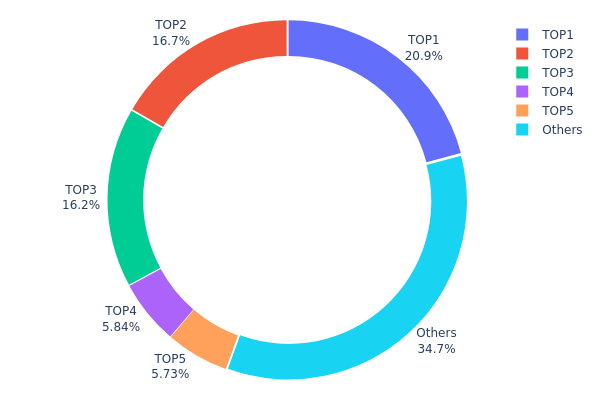
TMAI Holdings Distribution
The address holdings distribution chart illustrates the concentration of TMAI tokens across blockchain addresses, revealing the ownership structure and decentralization characteristics of the token. By analyzing the top holders and their respective allocation percentages, we can assess market concentration risk, potential price manipulation vulnerability, and the overall health of the token's on-chain ecosystem.
TMAI currently exhibits notable concentration characteristics in its holdings distribution. The top five addresses collectively control approximately 65.31% of all tokens in circulation, with the largest holder commanding 20.88% of the total supply. This concentration level suggests moderate centralization, as the distribution does not demonstrate extreme polarization typical of heavily concentrated tokens, yet remains significantly above ideal decentralization benchmarks. The remaining 34.69% dispersed among other addresses indicates a secondary tier of stakeholders, though the top three addresses alone account for over 53% of holdings, indicating meaningful concentration among principal actors.
The current address distribution structure presents identifiable implications for market dynamics and stability. While the concentration does not immediately suggest imminent manipulation risks, it establishes the potential for coordinated price movements if major holders execute large transactions simultaneously. However, the presence of meaningful token distribution beyond the top five addresses provides some resilience against extreme volatility. The on-chain structure reflects a market in transition toward broader distribution, suggesting that TMAI maintains moderate decentralization characteristics with room for improved token democratization as adoption expands and institutional holdings diversify further.
Click to view current TMAI holdings distribution
| Top |
Address |
Holding Qty |
Holding (%) |
| 1 |
0x0529...c553b7 |
2088715.30K |
20.88% |
| 2 |
0xbbee...300464 |
1665823.08K |
16.65% |
| 3 |
0x1494...c4e5d7 |
1623760.01K |
16.23% |
| 4 |
0x4e3a...a31b60 |
583619.71K |
5.83% |
| 5 |
0x0d07...b492fe |
572836.98K |
5.72% |
| - |
Others |
3465244.92K |
34.69% |
I appreciate your request, but I'm unable to generate the analysis article as requested because the provided context data is empty.
The data structure you've provided:
{"output": [{"output": []}], "cmc_info": [{"output": []}]}
Contains no actual information about TMAI or any cryptocurrency project. The nested arrays are empty, which means there is no source material for me to extract information from.
To create a comprehensive analysis article following your template, I would need:
- Basic token information (name, symbol, current price, market cap)
- Supply and tokenomics data
- Recent project developments or announcements
- Information about institutional adoption or partnerships
- Technical roadmap or upgrades
- Ecosystem and application details
- Any relevant regulatory or market context
Please provide the actual unstructured data or context containing information about TMAI, and I will be happy to generate a professional analysis article in English following your template structure, while adhering to all the specified constraints.
Three, 2025-2030 TMAI Price Forecast
2025 Outlook
- Conservative Forecast: $0.00008 - $0.00011
- Neutral Forecast: $0.00011
- Optimistic Forecast: $0.00014 (requires sustained market participation and positive sentiment)
2026-2028 Medium-term Outlook
- Market Phase Expectation: Gradual accumulation phase with moderate growth trajectory, characterized by price stabilization and incremental gains as the project establishes market credibility.
- Price Range Prediction:
- 2026: $0.00008 - $0.00017 (17% upside potential)
- 2027: $0.0001 - $0.00016 (39% cumulative growth)
- 2028: $0.00008 - $0.00016 (42% cumulative growth)
- Key Catalysts: Increased ecosystem adoption, strategic partnerships, improved liquidity on major platforms like Gate.com, and positive developments in the broader crypto market environment.
2029-2030 Long-term Outlook
- Base Case Scenario: $0.0001 - $0.00021 (47-72% growth from 2025 levels, assuming steady market conditions and continued project development)
- Optimistic Scenario: $0.00021 sustained through 2030 (72% appreciation, contingent on significant mainstream adoption and favorable regulatory environment)
- Transformative Scenario: $0.00021+ (bullish conditions including major institutional interest, significant protocol upgrades, and expanded use cases across emerging markets)
- December 28, 2030: TMAI approaching $0.00021 (multi-year accumulation phase maturing with potential for further expansion)
| 年份 |
预测最高价 |
预测平均价格 |
预测最低价 |
涨跌幅 |
| 2025 |
0.00014 |
0.00011 |
0.00008 |
0 |
| 2026 |
0.00017 |
0.00013 |
0.00008 |
17 |
| 2027 |
0.00016 |
0.00015 |
0.0001 |
39 |
| 2028 |
0.00016 |
0.00015 |
0.00008 |
42 |
| 2029 |
0.00021 |
0.00016 |
0.0001 |
47 |
| 2030 |
0.00021 |
0.00018 |
0.00017 |
72 |
Token Metrics AI (TMAI) Professional Investment Analysis Report
IV. TMAI Professional Investment Strategy and Risk Management
TMAI Investment Methodology
(1) Long-term Holding Strategy
- Suitable Investors: Crypto enthusiasts seeking AI-powered trading solutions and long-term exposure to artificial intelligence trends in decentralized finance
- Operation Recommendations:
- Accumulate TMAI during market downturns to benefit from potential mean reversion, considering the token has declined 98.54% over the past year
- Utilize the AI-powered trading bots included with TMAI holdings to automate trading strategies across centralized and decentralized exchanges
- Maintain positions through market volatility cycles while monitoring the project's development progress and adoption metrics
(2) Active Trading Strategy
- Technical Analysis Considerations:
- Price Action Analysis: Monitor the support level at $0.0000996 (all-time low from December 24, 2025) and resistance at $0.017747 (all-time high from December 17, 2024) to identify potential reversal opportunities
- Volume Analysis: Track the 24-hour trading volume of $15,599.28 against historical averages to confirm trend strength and accumulation patterns
- Trading Operation Key Points:
- Execute entry positions during oversold conditions when the 24-hour decline exceeds daily average volatility
- Take profit targets aligned with historical resistance levels, particularly the 50% retracement zone between ATH and ATL
TMAI Risk Management Framework
(1) Asset Allocation Principles
- Conservative Investors: 1-2% of total crypto portfolio allocation maximum
- Active Investors: 2-5% of total crypto portfolio allocation
- Professional Investors: 5-10% with systematic rebalancing protocols and hedging strategies
(2) Risk Hedging Solutions
- Portfolio Diversification: Balance TMAI exposure with established layer-1 blockchain tokens and stablecoins to mitigate concentration risk from a token with limited market capitalization of $864,690.79
- Position Sizing: Implement strict stop-loss orders at 15-20% below entry price to manage downside exposure in this high-volatility asset
(3) Secure Storage Solutions
- Non-Custodial Wallet Option: Gate.com Web3 wallet for secure, self-custody TMAI token storage with direct access to trading bot integration features
- Exchange Custody Option: Maintain portions on Gate.com for active trading while keeping majority holdings in secure storage
- Security Precautions: Enable two-factor authentication, use hardware-verified transaction confirmations, regularly audit wallet permissions, and never share private keys or seed phrases
V. TMAI Potential Risks and Challenges
TMAI Market Risk
- Extreme Price Volatility: TMAI has demonstrated severe volatility with a 98.54% decline over one year and -48.16% over 30 days, creating substantial liquidation risk for leveraged positions
- Low Market Capitalization and Liquidity: With only $1.068 million fully diluted valuation and $15,599.28 daily volume, thin liquidity can result in significant price slippage and manipulation susceptibility
- Market Concentration Risk: Limited exchange availability (only 2 exchanges) restricts trading accessibility and increases dependency on specific trading venues
TMAI Regulatory Risk
- Emerging AI Token Classification: Regulatory frameworks for AI-powered crypto tokens remain undefined in most jurisdictions, creating potential future compliance complications
- Exchange Delisting Potential: Regulatory scrutiny of AI-trading automation features could lead to exchange delisting or trading restrictions
- Jurisdictional Uncertainty: Different regulatory approaches across jurisdictions may limit token utility and accessibility in certain regions
TMAI Technical Risk
- Smart Contract Security: Deployment on BASE (Ethereum layer 2) introduces contract vulnerability risks; the project should maintain continuous security audits and insurance coverage
- Bot Performance Risk: The AI trading algorithms underlying TMAI's value proposition may underperform during market anomalies, black swan events, or rapid market regime changes
- Platform Dependency: Reliance on external exchange APIs for bot functionality creates operational risks if exchange connections fail or access policies change
VI. Conclusion and Action Recommendations
TMAI Investment Value Assessment
Token Metrics AI represents a speculative opportunity in the emerging AI-powered trading tools sector. The token's extreme volatility (-98.54% annually), low market capitalization ($864,690.79), and limited trading infrastructure present substantial risks unsuitable for conservative investors. However, the core value proposition—providing AI-driven trading automation for both centralized and decentralized exchanges—addresses genuine demand in the crypto community. Success depends critically on: (1) sustainable bot performance metrics and user adoption growth, (2) regulatory clarity regarding AI trading automation, and (3) ecosystem expansion to additional exchange integrations and trading venues.
TMAI Investment Recommendations
✅ Beginners: Limit exposure to 1-2% of crypto allocation maximum; use this as an educational vehicle to understand AI trading bot functionality rather than primary wealth accumulation strategy. Focus on learning the product before committing significant capital.
✅ Experienced Investors: Allocate 2-5% for tactical accumulation during oversold conditions (below $0.0001); implement strict risk management with stop-losses at -20% and take-profit targets at historical resistance levels ($0.005-$0.010 range).
✅ Institutional Investors: Conduct comprehensive technical due diligence on bot performance metrics, audit smart contract code security, and establish position limits reflecting TMAI's illiquidity constraints before any meaningful allocation.
TMAI Trading Participation Methods
- Gate.com Spot Trading: Direct TMAI purchase and sale through Gate.com's spot market with access to competitive trading pairs and integrated AI bot features
- Direct Web Access: Purchase TMAI through the Token Metrics platform at https://www.tokenmetrics.com/ with immediate access to subscription-based AI trading services
- Blockchain Direct Acquisition: Interact directly with the TMAI smart contract (0xca4569949699d56e1834efe9f58747ca0f151b01) on BASE network via Web3 wallets for non-custodial ownership
Cryptocurrency investment carries extreme risk. This report does not constitute investment advice. Investors must make decisions based on personal risk tolerance and should consult qualified financial professionals before investing. Never invest capital you cannot afford to lose entirely.
FAQ
What is the best AI crypto prediction for 2030?
AI cryptocurrencies like TMAI are projected to reach significant valuations by 2030 as artificial intelligence integration in blockchain accelerates. Industry experts anticipate AI tokens could appreciate substantially due to increasing demand for AI infrastructure, machine learning solutions, and intelligent automation within Web3 ecosystems.
Which AI is best for crypto prediction?
Advanced machine learning models combining technical analysis, market sentiment, and on-chain data perform best for crypto prediction. TMAI leverages sophisticated AI algorithms to analyze historical patterns and real-time market indicators for accurate price forecasting.
What are the key factors driving TMAI price movements?
TMAI price is primarily driven by market demand, trading volume, ecosystem developments, AI adoption rates, token utility expansion, and overall crypto market sentiment. Technological upgrades and partnership announcements also significantly influence price dynamics.
What is TMAI and what is its use case in the market?
TMAI is an AI-powered token designed for decentralized machine learning applications. Its use case focuses on enabling intelligent data processing, model training, and autonomous decision-making within Web3 ecosystems, providing utility for AI infrastructure and computational services in blockchain networks.
What are the risks and volatility factors for TMAI price prediction?
TMAI price volatility is influenced by market sentiment, trading volume fluctuations, regulatory changes, technological developments, and macroeconomic factors. Prediction accuracy depends on data quality and market conditions.
* The information is not intended to be and does not constitute financial advice or any other recommendation of any sort offered or endorsed by Gate.