Welcome back to the Chart Decoder Series, where we transform complex chart tools into simple, actionable trading strategies.
Today we visit Ichimoku Cloud, the Japanese trading system that does it all: trend, momentum, and future equilibrium, all at a glance.
The Origins of the Cloud
The Ichimoku Kinko Hyo (which literally translates to “one-glance equilibrium chart”) was developed by Japanese journalist Goichi Hosoda in the 1930s.
His goal was to create an indicator that lets traders see the full market picture: balance, direction, and momentum, instantly. No switching between tools. No guesswork. Just one glance.
Decades later, Ichimoku remains one of the most complete systems for analysing market structure. It shows not just where the price is, but where it should be heading.
What Ichimoku tells you:
- Which way the market is trending
- Where support and resistance levels sit
- What the momentum looks like
- Where price might movenext
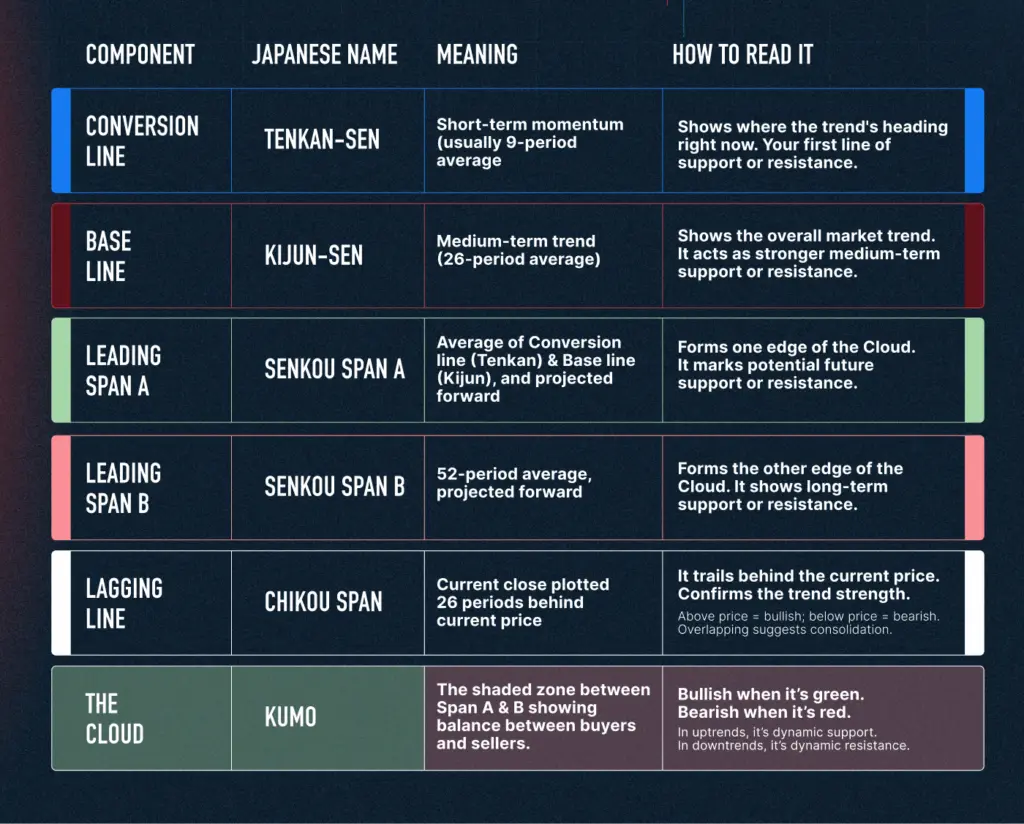
Understanding the components
 ngth and future resistance zones
- Green Cloud (Span A > Span B): Bullish sentiment
- Red Cloud (Span B > Span A): Bearish sentiment
3. Future ProjectionUnlike most indicators that lag, Ichimoku’s Cloud projects 26 periods into the future, showing where support or resistance is likely to form next.
4. Crossovers
Conversion and Base line relationship reveals momentum strength and potential turning points
- Bullish signal: Conversion line (blue) crosses above Base line (especially above the Cloud)
- Bearish signal: Conversion line (blue) crosses below Base line (especially below the Cloud)
5. Lagging Line Confirmation
Lagging Span position confirms whether the trend has genuine follow-through
- Lagging Span (white) above price = bullish confirmation
- Lagging Span (white) below price = bearish confirmation
Example in Action
According to Bitfinex Alpha 180 (issued on November 10th, 2025), Bitcoin’s recent 21 percent pullback from its October all-time high isn’t a collapse but a consolidation. The move below $100,000 marked the creation of a new base rather than the start of a sell-off, as on-chain data shows that long-term holders (the smart money) aren’t dumping their Bitcoin. Instead, they’re rebalancing their positions, taking some profits but keeping most of their holdings. Also, roughly 72% of all Bitcoin in circulation is still profitable at current prices, meaning most holders aren’t underwater and desperate to sell
Now, let’s see how these fundamentals line up with the Ichimoku Cloud on the daily BTC/USD chart on November 11th, 2025 and whether the technical picture supports this narrative of controlled consolidation.
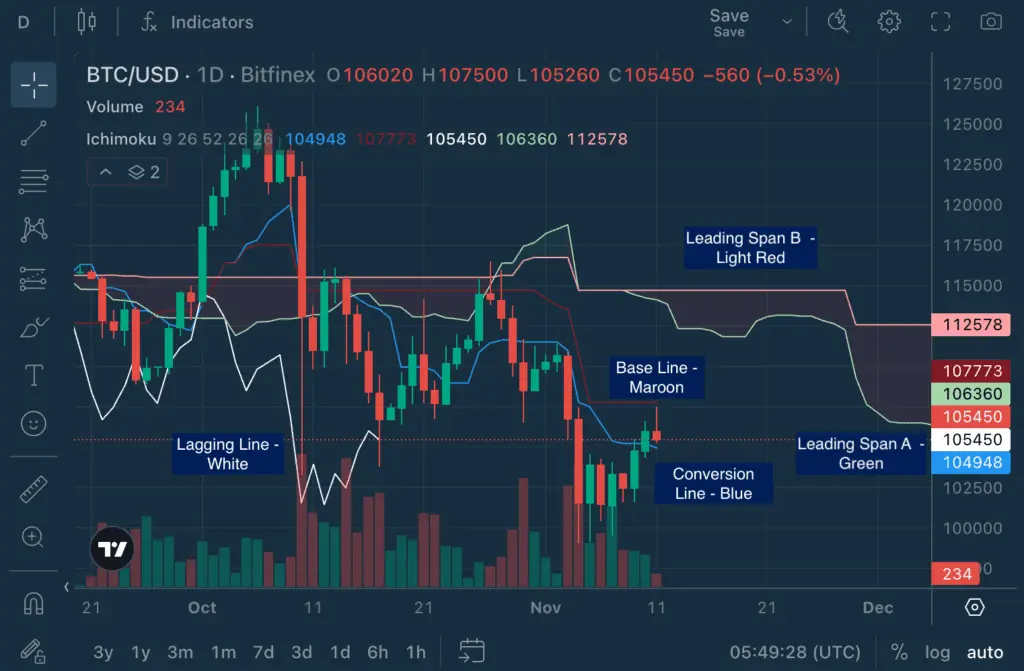
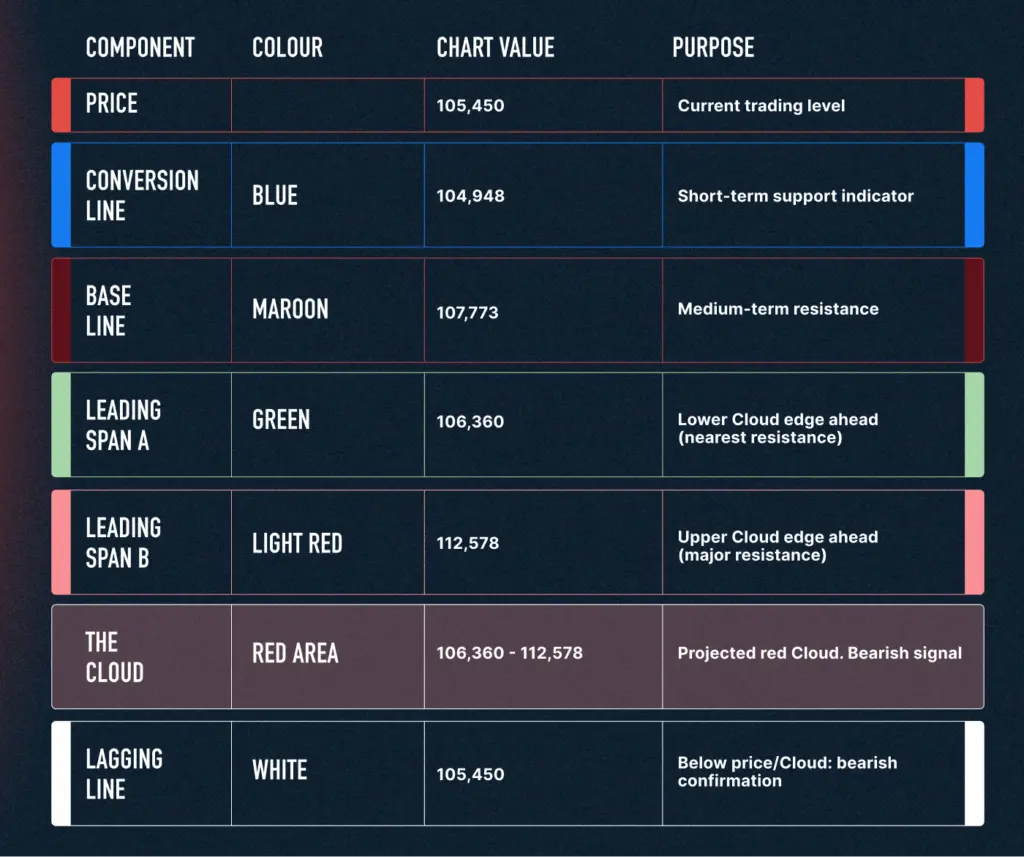 The price is sitting below the Cloud with a red, relatively flat Cloud ahead reflecting daily structure remains bearish. When price sits beneath the Cloud, sellers have the upper hand
The Conversion Line (104,948) sits below the Base Line (107,773), confirming short-term bearish momentum. The Lagging Line below both price and Cloud confirms that the broader trend is still down, and buyers haven’t taken control yet.
The Cloud projection ahead is red and relatively flat, spanning from 106,360 to 112,578. This 6,218-point range represents the equilibrium zone where buyers and sellers are expected to battle it out over the coming weeks. The flatness of the Cloud is significant as it confirms weak momentum. A thick, angled Cloud would signal strong directional conviction. A flat, horizontal Cloud like this one signals indecision. The market is pausing, not trending.
Looking ahead, The flat Cloud top near 112,500 acts as a strong ceiling, the price would need a decisive breakout above that to shift sentiment bullish. Until BTC clears both the Base Line and the Cloud, rallies are likely to face selling pressure For now, Ichimoku’s forward projection aligns with the broader market mood. The momentum is weak but stable, not accelerating downward. BTC is in what you could call a bearish consolidation.
Advanced Ichimoku Strategies
1. Trend + Momentum Alignment
The simplest yet most effective approach:
- Trade long when price and Cloud are bullish (price above green Cloud)
- Trade short when both are bearish (price below red Cloud)
- Ignore signals inside the Cloud It’s the fog of indecision
2. The “Three-Point Confluence” Setup
The highest-probability trades occur when:
- Conversion line (Tenkan) crosses Base line (Kijun)
- Price breaks above/below the Cloud
- Lagging Span (Chikou Span) confirms the move
When all three align, it’s a full Ichimoku confirmation: momentum, structure, and timing all pointing in one direction.
3. Cloud as Dynamic Support/Resistance
The thicker the Cloud, the stronger the zone. In uptrends, Span A and B act like a soft cushion. In downtrends, they form a ceiling that repels price.
4. Multi-Timeframe Analysis
When multi timeframes agree, it strengthens your conviction. If they disagree, it’s usually best to wait, conflicting Clouds mean conflicting forces.
5. Ichimoku + Volume or RSI
- Cloud + RSI oversold near support = potential bounce
- Cloud thinning + falling volume = early trend exhaustion
- RSI divergence near Cloud edges = potential reversal zone
Bonus Read: BTC/USD (1-Hour Chart)
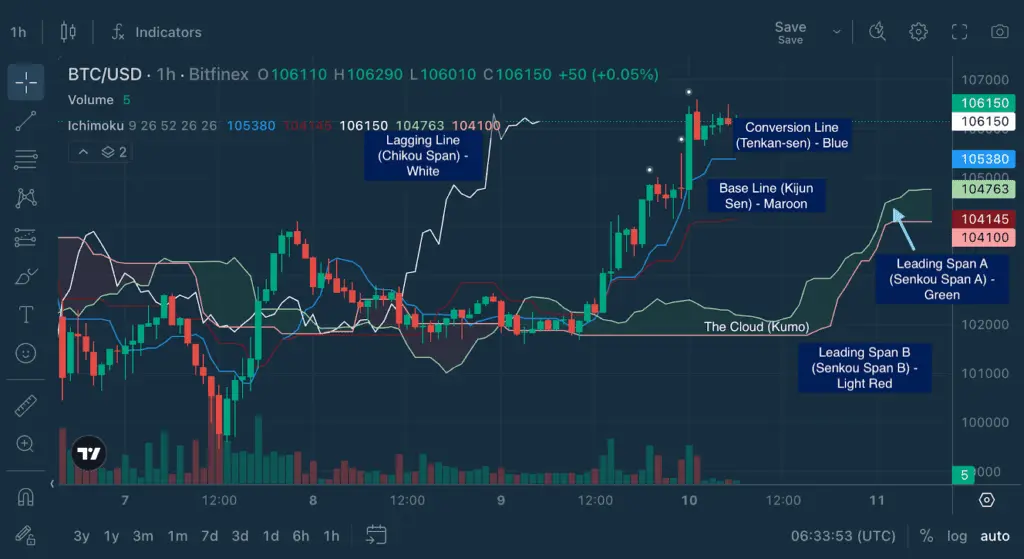
Let’s zoom in on the 1-hour chart within the same daily window on November 11th, 2025, and see how Bitcoin is behaving inside this consolidation phase.
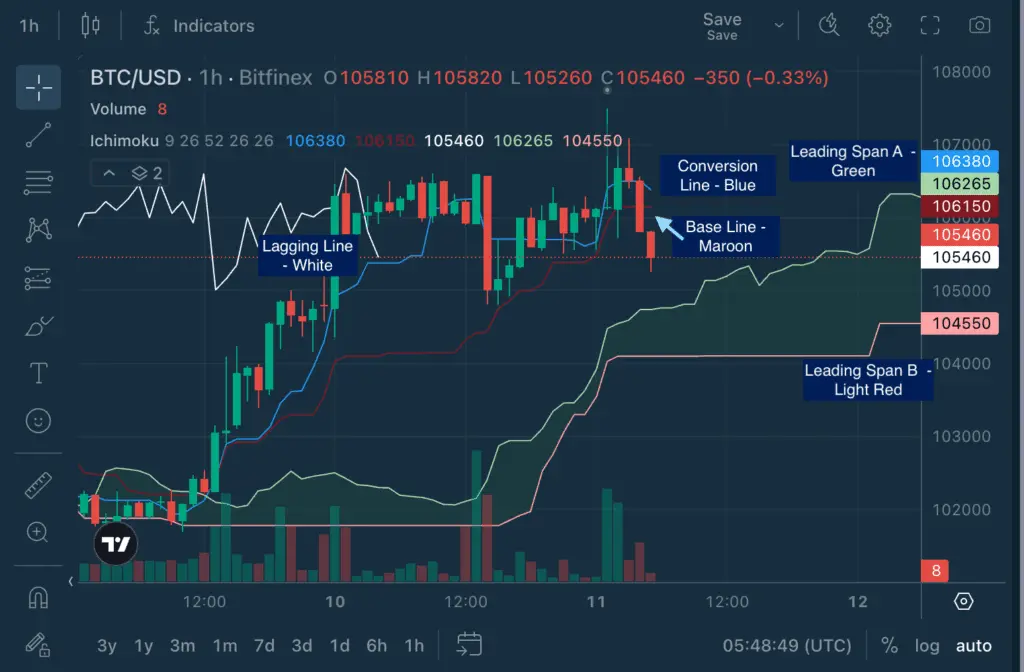
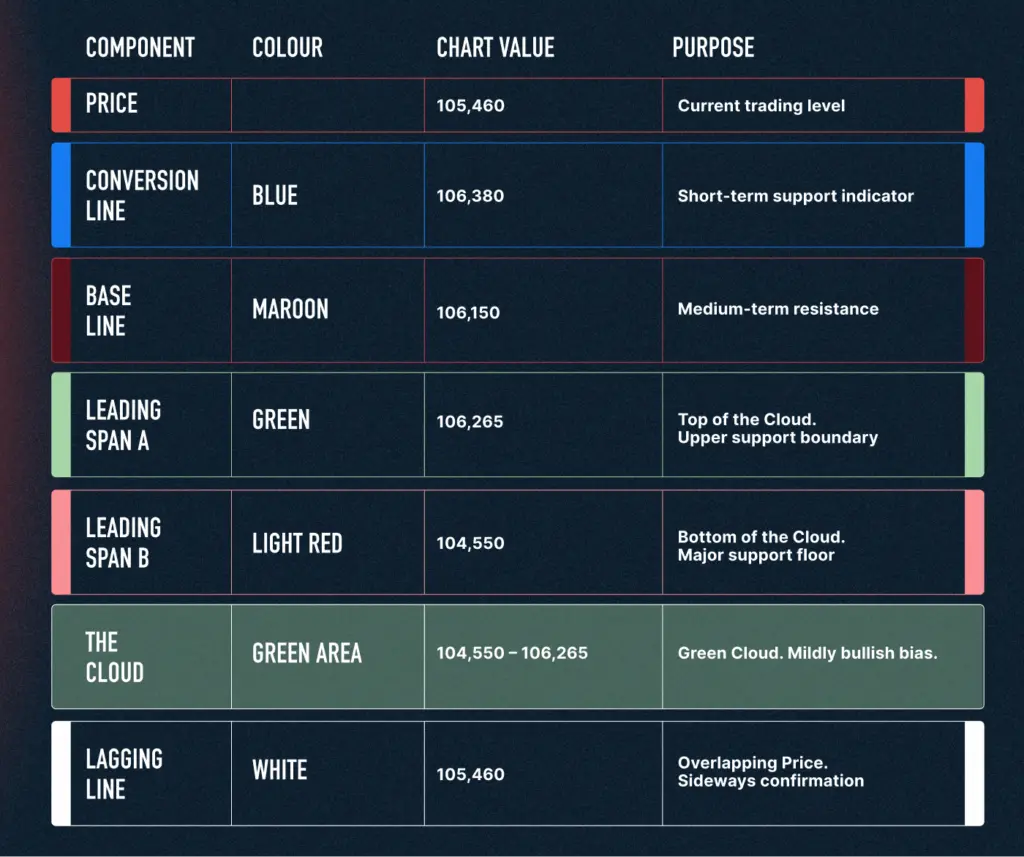 The price on the 1-hour timeframe shows short-term weakness inside a broader consolidation.
Both the Conversion Line (106,380) and Base Line (106,150) are flattening out and converging. The gap between them is only about 230 points. This narrow gap signals virtually no momentum in either direction. The market is coiling, not trending
The Cloud remains green and slightly rising, which means the underlying 1-hour structure maintains a mild bullish bias. However, buyers are struggling to sustain any meaningful momentum above 106k. Each push higher gets met with selling pressure.
If price holds above the top of the Cloud, it could rebound toward 106.3k – 106.5k. A close below 104.5k would shift bias back to short-term bearish.
The 1-hour chart confirms a consolidation inside a larger consolidation base, a wait and see period.
Common Mistakes to Avoid
1. Trading inside the Cloud:
That’s no-man’s-land. Signals here are weak and unreliable. The Cloud represents equilibrium, a battle zone where neither buyers nor sellers have control. Wait for a clear breakout above or below.
2. Ignoring Cloud projection:
A flat or narrowing Cloud ahead often signals fading momentum. It’s telling you the trend is losing steam. Pay attention to what the Cloud is showing you about the future, not just the present.
3. Overcomplicating it:
Ichimoku already combines five indicators into one. Adding more tools defeats the purpose. Trust the system and keep it simple
4. Fighting major news:
Even the best Cloud can’t stop a macro storm. Central bank decisions, regulatory announcements, and major economic data can override technical signals. Always check context.
Setting It Up on Bitfinex
- Go to trading.bitfinex.com
- Select your trading pair
- Click Indicators → Ichimoku Cloud
- Default settings (9, 26, 52, 26) are standard
- Watch how the Cloud projects future support and resistance zones
See Ichimoku Cloud in action Check out other toolboxes from the Chart Decoder series:
- SMA vs EMA for trend direction
- MACD for momentum shifts
- RSI for overbought/oversold zones
- Bollinger Bands for volatility and price extremes
- Stochastic Oscillatorfor timing reversals
- VWAP for fair price detection
- Volume + OBVfor spotting smart money flow
- ATR for volatility-based risk management
- Fibonacci Retracements for market pullbacks
- StochRSI for precision timing
The post Chart Decoder Series: Ichimoku Cloud – Your Complete Trading Dashboard on a Single Chart appeared first on Bitfinex blog.
