Bitcoin (BTC) and Ethereum (ETH) are approaching important resistance levels during Friday’s trading session. If successfully broken, the leading cryptocurrencies could trigger a new bullish cycle. Conversely, Ripple (XRP) remains firm at a strong support zone, hinting at a potential rebound if buying pressure continues to dominate.
Bitcoin could surge if it closes above the critical resistance zone
Bitcoin’s price was rejected at the 61.8% Fibonacci retracement level at $94,253 (calculated from the April low of $74,508 to the all-time high of $126,199 set in October) on Wednesday, causing the rally to stall. The next day, BTC quickly regained momentum after successfully testing the psychological level of $90,000. As of writing on Friday, this cryptocurrency is fluctuating around $92,000.
If Bitcoin can break above the downtrend line and close above the resistance at $94,253, the market could see an extended rally toward the psychological zone of $100,000.
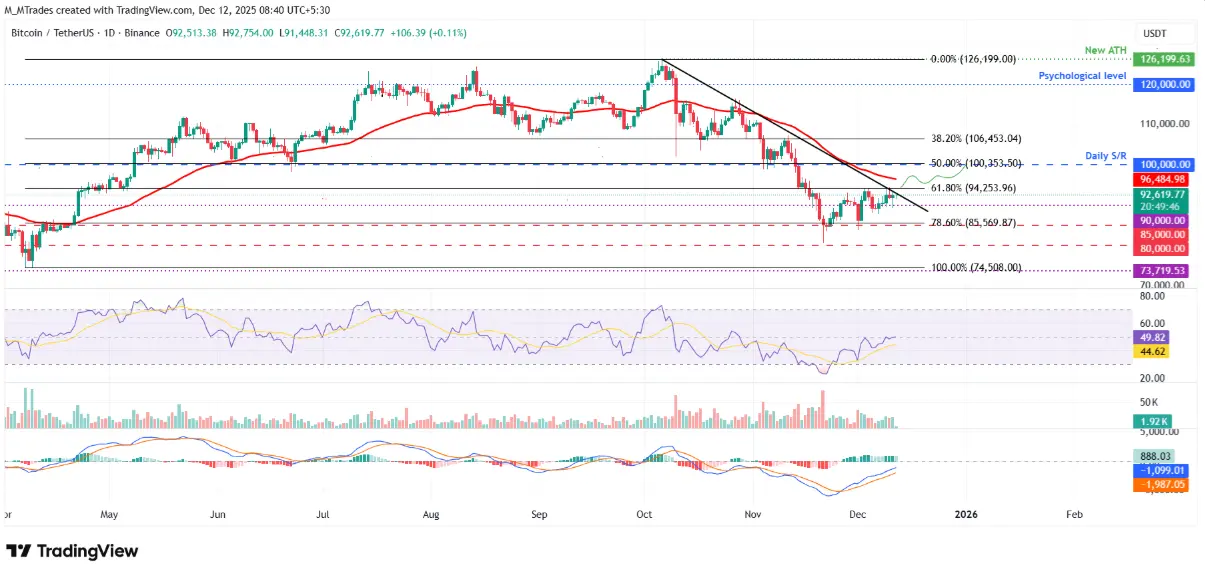 Daily BTC/USDT chart | Source: TradingViewTechnical indicators are also leaning bullish. The daily RSI is approaching the neutral zone of 50, indicating a weakening of selling pressure; to confirm an upward trend, RSI needs to climb back above this level. Meanwhile, the MACD has formed a bullish crossover since late November and continues to support the bullish outlook.
On the other hand, if selling pressure returns and BTC resumes a correction, the next key support level is at $85,569, corresponding to the 78.6% Fibonacci retracement.
Ethereum could extend its gains if it closes above the 50-day EMA
Ethereum’s price broke above a descending trendline — formed by connecting the peaks since October 7 — on Tuesday, recording a 6.21% gain. However, the recovery quickly stalled as ETH hit resistance at the 50-day EMA (3,310 USD) on Wednesday, leading to a slight correction in the following session. As of Friday, ETH is approaching this important EMA again.
 Daily ETH/USDT chart | Source: TradingViewIf Ethereum can firmly close above the 50-day EMA at $3,310, bullish momentum is likely to be triggered, paving the way toward the next significant resistance zone around $3,592.
Technical indicators are supporting the bulls: the daily RSI has risen to 54, crossing above the neutral 50 threshold, reflecting an expanding upward momentum. The MACD also maintains a bullish crossover signal, reinforcing the short-term bullish outlook.
Conversely, if selling pressure returns, ETH could retreat to the daily support zone at $3,017 to find a new balance point.
XRP finds support around a key zone
XRP’s price rebounded from the $1.96 support zone on Sunday, gaining 3.66% over the next two days. However, by Wednesday, selling pressure returned, causing XRP to sharply correct, almost erasing previous gains, and once again testing the $1.96 level in the following session. As of Friday, the price is hovering around $2.03, reflecting market caution.
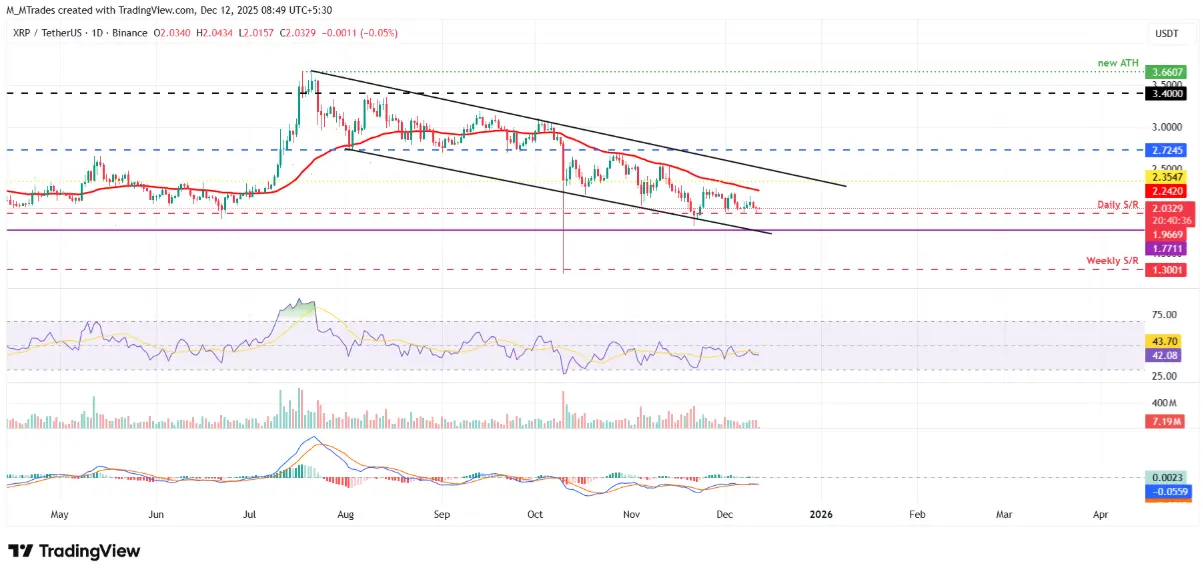 Daily XRP/USDT chart | Source: TradingViewIf the $1.96 support continues to hold, XRP could sustain its recovery and aim for the next resistance target at $2.35. On the daily chart, the RSI stands at 42 — approaching the neutral zone of 50 — indicating waning selling pressure. To confirm a clearer bullish trend, RSI needs to break above this midpoint. However, MACD lines remain converging, signaling uncertainty among traders.
Conversely, if XRP closes below the $1.96 level, the downtrend could resume, pushing the price lower to deeper support at $1.77.
Disclaimer: The information on this page may come from third parties and does not represent the views or opinions of Gate. The content displayed on this page is for reference only and does not constitute any financial, investment, or legal advice. Gate does not guarantee the accuracy or completeness of the information and shall not be liable for any losses arising from the use of this information. Virtual asset investments carry high risks and are subject to significant price volatility. You may lose all of your invested principal. Please fully understand the relevant risks and make prudent decisions based on your own financial situation and risk tolerance. For details, please refer to
Disclaimer.
Related Articles
Bitcoin Falls 2% as Oil Prices Rally on Energy Shortage Fears
Bitcoin fell nearly 2% within a 15-minute window on Sunday as oil surged on escalating Middle East tensions, underscoring how energy-market shocks can ripple into the crypto space. Data from the decentralized derivatives platform Hyperliquid showed crude prices jumping from
CryptoBreaking13m ago
BTC Price Fluctuation Analysis
# BTC March 10, 2026 00:15-00:30 (UTC) Price Movement Deep Attribution Report
## 1. Overview
Between 00:15 and 00:30 (UTC) on March 10, 2026, Bitcoin (BTC) experienced a significant price movement, with a return of +0.82%. This report will systematically analyze the possible reasons for the BTC price fluctuation during this period based on on-chain data, market conditions, macro environment, capital flows, derivatives market, online public opinion, and other dimensions, providing an in-depth attribution.
## 2. Market Review and Data Overview
###
GateNews20m ago
Bitcoin vs Gold: ETF Flows Signal Early Capital Rotation
Bitcoin ETF flows have shifted into positive territory over the last 30 days, even as gold ETF demand shows signs of fatigue after a prolonged rally. In the latest data pulse, bitcoin-focused funds logged a net inflow of $273 million on March 6 after a $1.9 billion outflow in February, while GLD—the
CryptoBreaking23m ago
The orbital data center company will begin mining Bitcoin in space
Starcloud – An orbit data center startup backed by Nvidia – will become the first company to mine Bitcoin from space when their second spacecraft is launched later this year. This is
TapChiBitcoin30m ago
Bitcoin funding rates hit a three-month low, are the bears "jumping the gun" before the non-farm payroll data?
This article analyzes the dynamics of the Bitcoin derivatives market, pointing out that before macroeconomic data releases, the market shows downward risks through funding rates, open interest, and liquidation data. Negative funding rates, high open interest, and the subsequent employment report collectively influence market direction, revealing how the derivatives market quickly reflects macro pressures and trader sentiment.
PANews45m ago