-
ENA trades near a historically reactive $0.20 zone that previously preceded a multi-month upside expansion.
-
Volume-weighted funding remains negative, reflecting sustained short exposure without panic-driven liquidation behavior.
-
Price structure signals controlled distribution, with downside risk defined and rebounds treated as corrective.
ENA trades near a historically significant demand area as recent price action remains under pressure. Market structure shows controlled selling, muted volatility, and cautious positioning across spot and derivatives venues.
Long-Term Chart Structure Focuses on a Key Demand Zone
ENA three-day chart places emphasis on repeated interactions with the same horizontal support area. Ali Charts observed that prior visits to this zone preceded sharp upside expansions after extended consolidation. Each historical test showed price compression before reversing, signaling longer-term capital participation. This recurring behavior increases the technical relevance of the level across multiple market cycles.
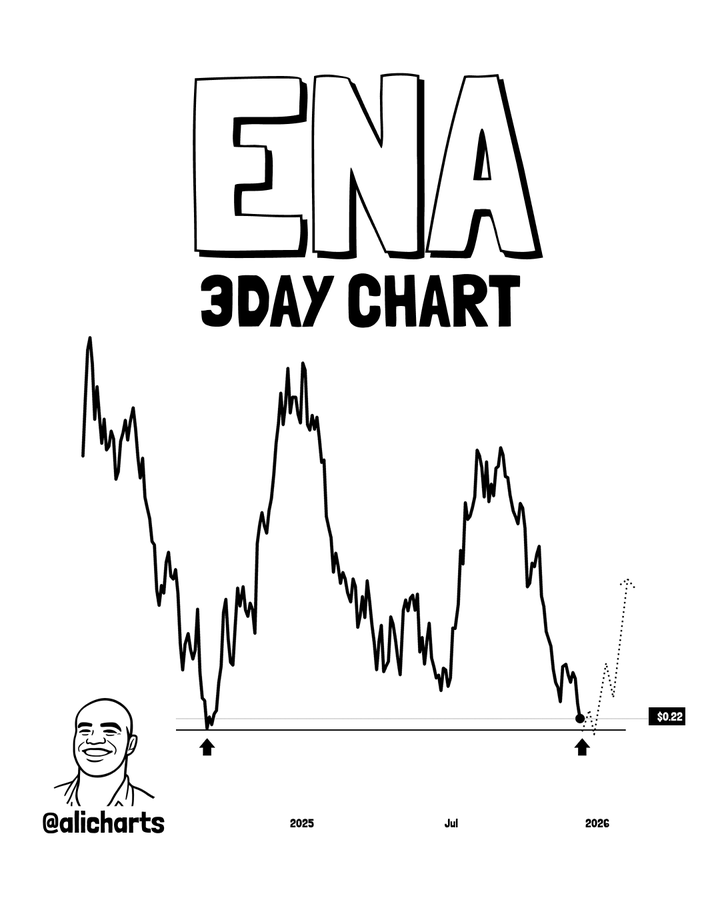
Source: X
The previous rally from this region delivered a 540% advance after sellers gradually exhausted. That move followed basing action rather than momentum-driven expansion.
This context frames the current setup as location-based instead of timing-dependent.
Structural symmetry suggests mean reversion remains active despite the corrective backdrop.
Recent price behavior shows progressively lower highs forming into the support test.
This reflects a corrective phase rather than confirmation of a structural breakdown.
Earlier cycles displayed similar retracements before volatility expanded higher.
Sustained acceptance above support would carry greater weight on higher timeframes.
Intraday Price Action Reflects Controlled Distribution
ENA lower-timeframe structure shows repeated failures near the $0.223–$0.225 resistance zone. Each advance met immediate supply, establishing a clear intraday lower-high sequence. Once price slipped below the $0.217 area, bearish control became evident. From there, price formed consistent lower lows without meaningful demand reactions.
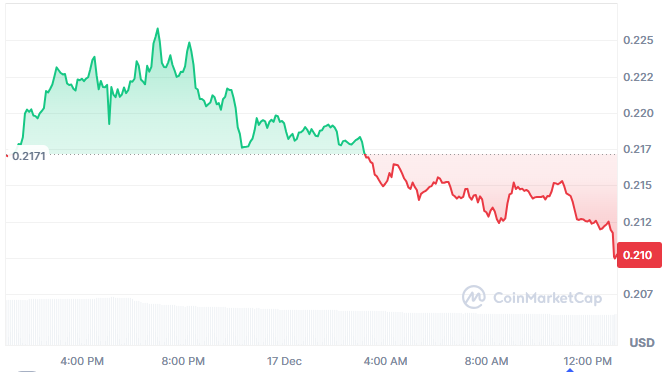
Source: coinmarketcap
Volatility remained contained, with shallow wicks and orderly candles throughout the decline.
This behavior aligns with distribution by stronger hands rather than emotional capitulation.
Such conditions often allow trends to persist as bids withdraw incrementally.
The absence of sharp liquidation events reinforces the controlled nature of selling.
The $0.210–$0.212 area now serves as the final visible shelf before deeper downside.
Acceptance below that region would likely expose liquidity near the $0.20 psychological level. For recovery attempts, reclaiming $0.217 on a closing basis remains essential.
Without that reclaim, rebounds continue to classify as corrective movements.
Funding Rates Confirm Persistent Bearish Positioning
ENA’s derivatives data reinforces the prevailing bearish market posture.
Volume-weighted funding has stayed predominantly negative since mid-September.
Repeated negative spikes show shorts paying premiums to maintain exposure.
This behavior reflects sustained bearish leverage rather than short-lived sentiment shifts.
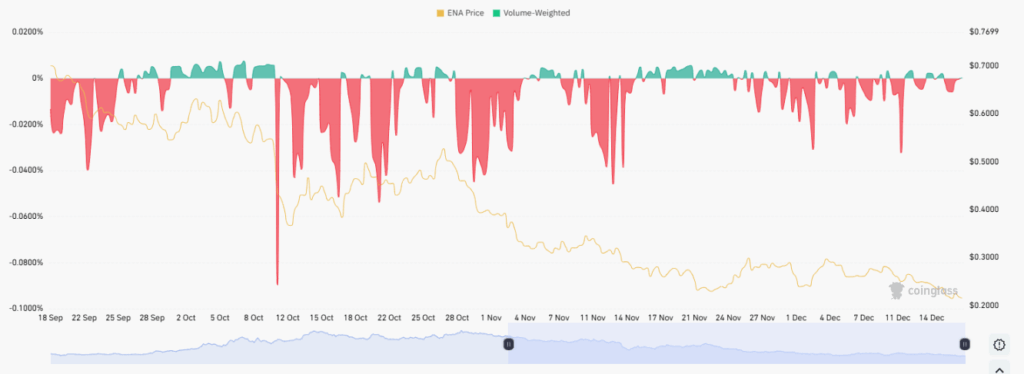
Source: Conglass
During brief rebounds in October and November, funding only flattened temporarily. Positive readings failed to persist before reverting negative. Rallies were treated as opportunities to re-establish short exposure. Despite crowding, the market did not produce a sustained short squeeze.
More recently, funding readings have compressed closer to neutral levels. This suggests downside momentum may be losing efficiency without confirming reversal signals. Such compression often precedes volatility expansion or positioning adjustments. Until funding turns positive and holds, upside moves remain structurally corrective.
Disclaimer: The information on this page may come from third parties and does not represent the views or opinions of Gate. The content displayed on this page is for reference only and does not constitute any financial, investment, or legal advice. Gate does not guarantee the accuracy or completeness of the information and shall not be liable for any losses arising from the use of this information. Virtual asset investments carry high risks and are subject to significant price volatility. You may lose all of your invested principal. Please fully understand the relevant risks and make prudent decisions based on your own financial situation and risk tolerance. For details, please refer to
Disclaimer.
Related Articles
BTC 15-minute rise of 0.60%: ETF capital inflows and technical breakout resonance drive short-term momentum
2026-03-13 12:45 to 2026-03-13 13:00 (UTC), BTC achieved a +0.60% return within 15 minutes, with a price range of 72341.6-72888.0 USDT and a volatility amplitude of 0.76%. Short-term price oscillations noticeably intensified. Due to abundant trading volume, market attention rose rapidly, reflecting a phase of strengthened buying power.
The primary drivers of this movement are continuous net inflows into ETFs and a technical breakout of key structures. In March 2026, BTC spot ETFs attracted capital inflows as high as 1.6 billion dollars in a single week.
GateNews9m ago
DeFi enters a "winter of yields": liquidity stagnation, leverage contraction, and the disappearance of arbitrage opportunities
The DeFi market entered an "interest rate winter" since September 2025, with deposit rates for major stablecoins declining sharply and supply-demand imbalances causing liquidity congestion. The rate decline reflects reduced capital demand and a lack of high-return opportunities. Stablecoin lending demand has dropped significantly, with market risk appetite shifting toward more stable investment channels. In response to this situation, the Sky protocol demonstrates competitiveness and adaptability by introducing real-world assets to enhance yields. The low interest rates during this phase can be viewed as an opportunity for DeFi market transformation.
区块客13m ago
"Seeking a Sword by Marking a Boat" - Style Coin Price Predictions Go Viral: The Practical Logic and Flaws of Mystical Prophecies
Author: Frank, PANews
Whenever the market enters a confusing phase of going nowhere, people try to use a "cutting the boat to seek the sword" method of historical retrospection to predict the next market movement. In such cases, people often see from these theories and charts that history always repeats itself, and seem to automatically overlay and verify future price movements with a certain period in the past.
This coincidence seems to have a magical effect and is often verified. Some bloggers claim this prediction method has an accuracy rate of 75%~80%.
Does this "cutting the boat to seek the sword" style price prediction that repeatedly goes viral on social media help the market identify stages, or is it just packaging noise as prophecy?
From "Tick Fractals" to "History Rhyming"
The peak operation regarding predictions of October 2025 market tops is an analyst named CryptoBullet, who created a method called "ti
区块客17m ago
Surviving Oscillating Markets: How Retail Investors Can Minimize Losses? Capital Flow Trends and Practical Guide
Author: MyToken
In the crypto market, sentiment often emerges more easily than logic. When "volatility" becomes the norm for the broader market and "anxiety" becomes the prevailing mindset among retail investors, a discussion on how to "lose less money" carries more practical significance than any macro narrative presentation.
Recently, the renowned data aggregation platform MyToken hosted an AMA event themed "In the Current Market, How Can Retail Investors Lose Less Money? Capital Flow and Practical Guide." The event invited independent trader BTC Bull Demon King and KTX Exchange CMO Christine, who provided puzzled investors with a practical "survival guide" from the perspectives of independent traders and trading platforms respectively.
Below is a highlight recap of this AMA.
---
Market Phase Consensus: Stop Fantasizing About a Bull Run, This is a "Consolidation Phase"
Market positioning is a relatively important issue, as it directly determines the next
PANews1h ago
NAV Price Surges 44.25%: Is a New Trend Emerging?
NAV coin recently surged by 44.25%, reaching $0.032715, amid increased trading activity and fluctuating market conditions. Analysts attribute this rally to rising on-chain activity and shifting sentiment toward altcoins, while traders monitor key price levels for future movements.
Coinfomania3h ago
Why TARA Just Skyrocketed 24.47% in 60 Minutes
TARA's price surged 24.47% to $0.000047 amid mixed signals in the crypto market and increased trading activity. Market conditions and macroeconomic factors are influencing investor sentiment, with traders closely monitoring key resistance and support levels.
Coinfomania3h ago