Analysts point out that Bitcoin is hovering near the “critically important long-term support line” and has been holding on for 3 weeks, which has put the nerves of the long positions in the market on edge. However, the publicly traded company Strategy (MSTR), the world's largest Bitcoin holder, has already seen its stock price break this “safety line” first, sending a strong bearish signal to the crypto assets market.
CoinDesk senior analyst and chartered market technician Omkar Godbole explained that this “safety line” is the extremely critical “100-week simple moving average (100-week SMA)” in technical analysis, which mainly reflects the average cost over the past two years. It is an indicator used by major market technical analysts to identify significant trend reversals, long-term support, or confirm crashes.
From a trend perspective, the 100-week moving average has provided strong support for three consecutive weeks, stopping the severe fall of Bitcoin from its historical high of $126,000.
Omkar Godbole describes this moving average as a “safety net” that successfully catches Bitcoin when the price falls.
If the coin price can rebound here, the market will expect this support to act as a “springboard,” becoming the starting point for a new wave of counterattack; conversely, if the coin price falls below the 100-week moving average, it may lead to a loss of confidence among holders, increased selling pressure, and allow the bears to further seize control, potentially expanding the downtrend.
Concerningly, the stock price trend of Strategy (MSTR) seems to have already rehearsed the worst-case scenario. Please see the trend comparison in the chart below:
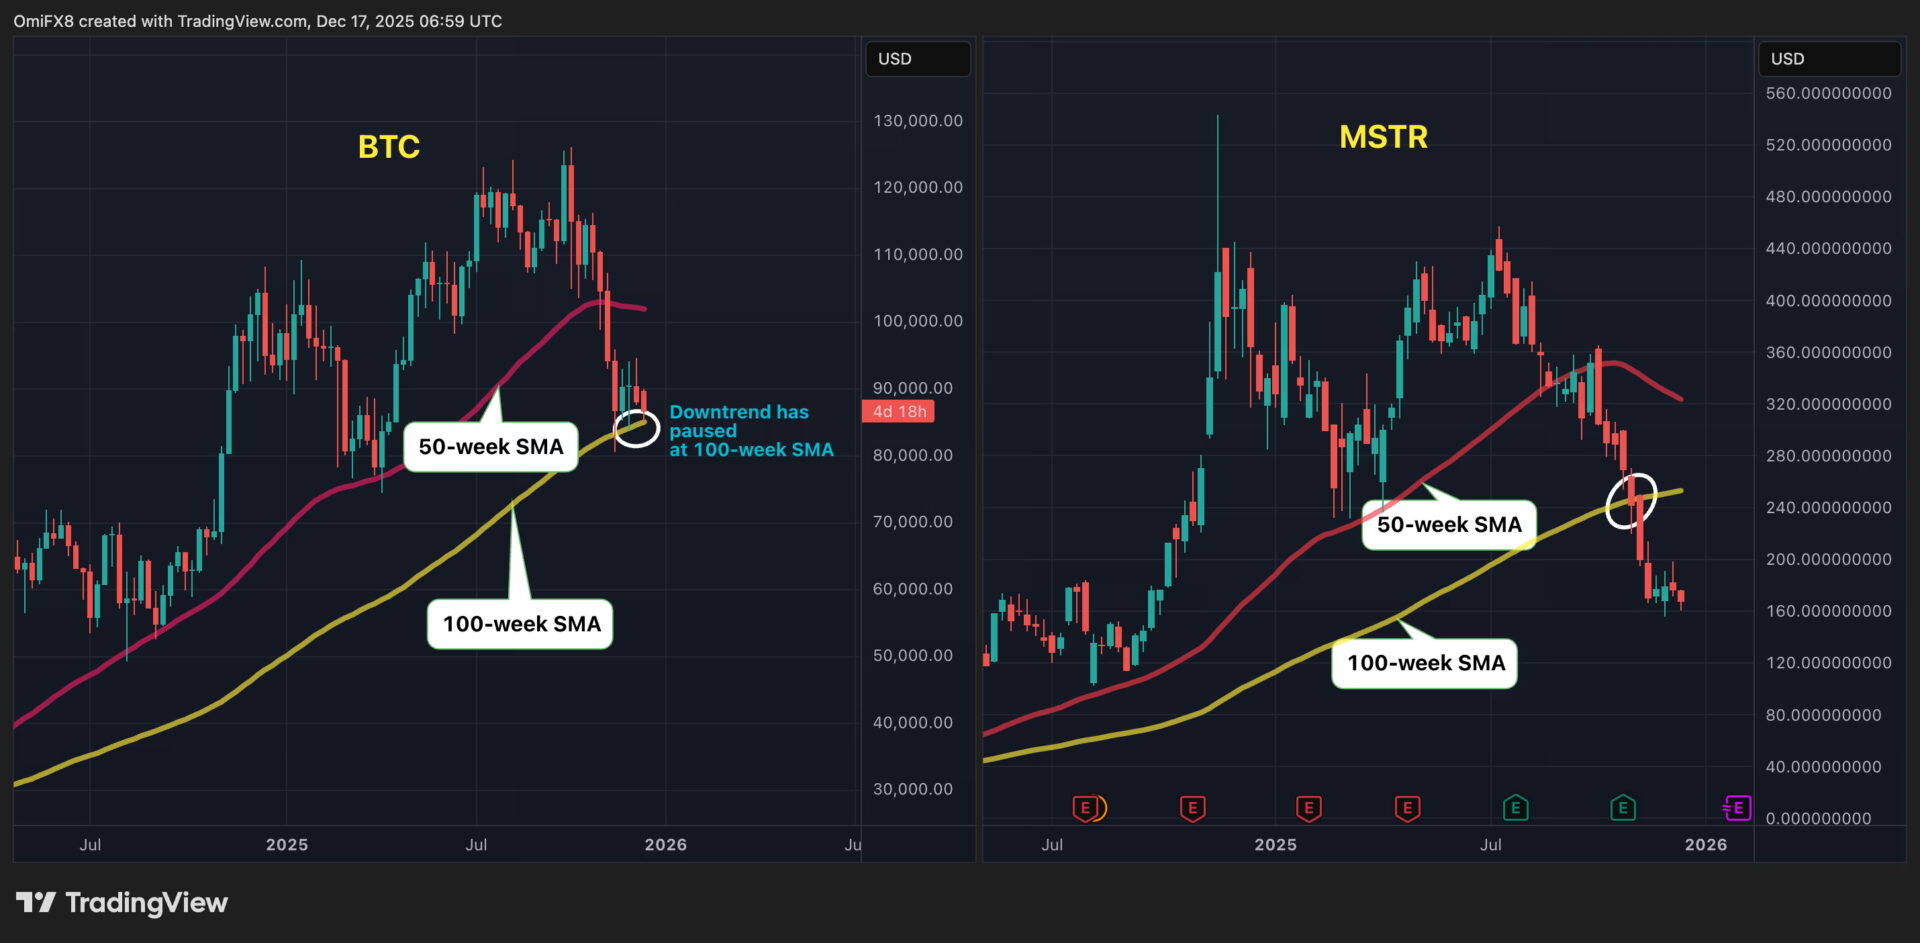
The MSTR stock price fell below the 100-week moving average when it dropped to $220 at the beginning of November, and the selling pressure continued to expand, with the stock price plunging all the way down to $160, a decline of over 60% from this year's high of $457.
For Bitcoin long positions, this is a signal that cannot be ignored, as MSTR has previously led the Bitcoin trend multiple times. Earlier, when MSTR broke below the 50-week SMA, which is also seen as a long-term trend watershed, it also indicated that the subsequent market for Bitcoin would weaken.
The current situation is very clear: Bitcoin long positions must defend the 100-week moving average at all costs.
If it can hold, this will become the starting point for a counterattack; if it unfortunately loses support, Bitcoin is likely to follow in MSTR's footsteps, falling into a deeper decline.
_
Disclaimer: This article is for providing market information only. All content and opinions are for reference only and do not constitute investment advice, nor do they represent the views and positions of the blockchain. Investors should make their own decisions and trades, and the author and blockchain will not bear any responsibility for direct or indirect losses incurred by investors' trades.
_
Tags: 100-week Simple Moving Average 100-week SMA Omkar Godbole analyzes the Crypto Assets market coin price investment support Bitcoin Moving Average market trend
Disclaimer: The information on this page may come from third parties and does not represent the views or opinions of Gate. The content displayed on this page is for reference only and does not constitute any financial, investment, or legal advice. Gate does not guarantee the accuracy or completeness of the information and shall not be liable for any losses arising from the use of this information. Virtual asset investments carry high risks and are subject to significant price volatility. You may lose all of your invested principal. Please fully understand the relevant risks and make prudent decisions based on your own financial situation and risk tolerance. For details, please refer to
Disclaimer.
Related Articles
XRP Holds $1.34 Support While Leverage Heatmap Highlights $1.30 Risk Zone
XRP is trading at $1.36 in a tight range of support at $1.34 and resistance at $1.37.
The heatmap data indicates that there is a huge amount of long positions in the range of $1.30.
Should prices fall to around $1.30, long positions with high leverage in this region might
CryptoNewsLand27m ago
ETH drops 1.07% in 15 minutes: whale fund concentration triggers short-term pullback
March 10, 2026, 18:00 to 18:15 (UTC), ETH's return within the 15-minute candlestick was -1.07%, with price fluctuations ranging from 2049.1 to 2073.15 USDT, an amplitude of 1.16%. During the same period, market trading volume significantly increased by over 32%, large on-chain fund flows occurred frequently, triggering short-term market sentiment fluctuations, rapidly increasing attention, and intensifying volatility risks.
The main driver of this abnormal movement is the concentrated sell-off by whale funds. On-chain data shows that within this time window, there were four large transfers exceeding 5000 ETH, all flowing to a major...
GateNews41m ago
BTC 15-minute decline of 0.70%: On-chain large transfers and macro bearish signals resonate, triggering short-term selling pressure
From 18:00 to 18:15 (UTC) on March 10, 2026, BTC experienced a significant price fluctuation, with a 15-minute return of -0.70%. The price range was 70366.3-70915.0 USDT, with an amplitude of 0.77%. During the same period, trading volume increased by 18% compared to the previous hour's average, and the order book depth temporarily narrowed, indicating increased market volatility and heightened attention.
The main drivers of this fluctuation were multiple large on-chain fund transfers and macro news resonance. Between 18:03 and 18:12, there were several on-chain transactions exceeding 500
GateNews41m ago
XRP Slides to $1.42 After Losing $1.80–$2 Neckline as $1.39 Support Faces Immediate Test
XRP dropped to less than the $1.80-2 neckline and a key support area became an overhead and the overall trend was altered.
The current short-term trading corridor is between the support and resistance of the asset which is between $1.39 and $1.47 respectively.
A price above $1.39 will
CryptoNewsLand1h ago
Solana Approaches Key Sell Wall at $84.78 — Will Momentum Hold for a Move Toward $89?
Solana is trading at an approximate price of $83.18, although a solid sell wall is at an approximate price of $84.78, which prevents upward movement.
The price is trapped between the support at $81.99 and the resistance at $84.78 which is short term consolidation.
Once buyers hit the
CryptoNewsLand1h ago
Polkadot Holds $1.46 Support as Descending Channel Caps Upside Near $1.53
The heaviest resistance is at the 4-hour chart where DOT trades within a downward channel and resistance levels are formed near the levels of $1.50-$1.53.
The nearest support is at $1.46 and a more profound zone of demand is at the range of $1.38 to $1.40.
Even with a 1.5 price drop, DOT
CryptoNewsLand1h ago