

The Hedera (HBAR) price has stayed quiet, but activity around the network has picked up. This week, Virginia launched a live environmental credit market built on Hedera, and energy company Repsol joined the Hedera governing council.
Both moves point to growing real-world use, even as the price continues to drift lower.
Though the market has not reacted yet, these events have still kept Hedera in the limelight. Traders are now waiting to see if the HBAR price is able to sustain major levels of support or if the downtrend still has further to go.
- What the Hedera Chart Is Showing
- Market Indicators Signal Stabilization, Not a Reversal
- HBAR Price Short-Term Outlook for This Week
What the Hedera Chart Is Showing
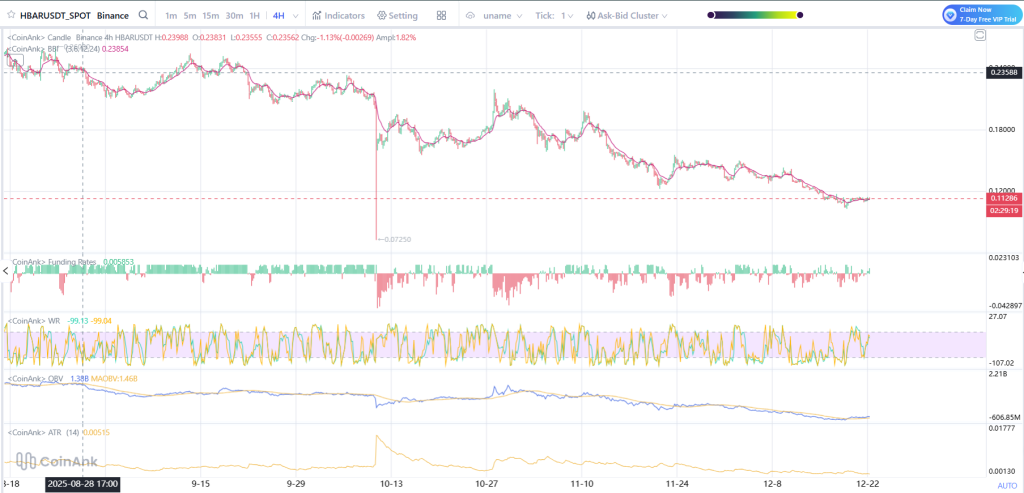
On the 4H chart, Hedera has been in a steady downtrend since late September, sliding from the $0.23 area to around $0.11–$0.12. The structure remains defined by lower highs and lower lows.
The Hedera price is now consolidating towards the lower end of the range. Although there has been some reduction in sell pressure, there isn’t any indication of an upcoming reversal either. Since the big breakdown in mid-October, all attempts at a rebound have failed short of previous levels of resistance.
HBAR is being supported at around $0.11. However, the price is still below critical Moving Averages, and levels that earlier acted as supports at around $0.18 and $0.23 have become resistance levels. Crossing those levels seems impossible at least in the short term.
Holding $0.11 is critical. A breakdown below that level would likely shift focus toward the $0.10 area.

Source: Coinank
Market Indicators Signal Stabilization, Not a Reversal
Funding rates remain marginally negative, indicating the predominance of short sentiment continues. However, the fervor in bearish sentiment has moderated compared to what was observed in the initial half of this month, lessening the probability of a rapid flush-through.
The Williams %R oscillator is close to the oversold level, showing a stretched momentum on the downside. This occurs prior to a short-term pop in the market.
Volume on balance is still declining, reinforcing the view that there has not yet been a return to purchasing interest. Further on the topic of volatility measures, the ATR values are placid on the whole.
_Read Also: _****XRP Indicator Points to Possible Short-Term Top
HBAR Price Short-Term Outlook for This Week
For the coming week, HBAR upside appears limited unless buyers reclaim lost ground quickly. A relief bounce towards the $0.13-$0.14 region may be expected if prices remain above $0.11 and if short-term momentum supports.
A better buy would require a breakout above $0.15, but that seems to be difficult at the moment. A decrease of $0.11 will shift the attention to $0.10, which might be a buy point but will also generate greater selling pressure if it fails.
For now, the HBAR price looks more like a market in pause than one ready for a breakout. Traders will be watching support closely, while longer-term developments continue to build quietly in the background.
Disclaimer: The information on this page may come from third parties and does not represent the views or opinions of Gate. The content displayed on this page is for reference only and does not constitute any financial, investment, or legal advice. Gate does not guarantee the accuracy or completeness of the information and shall not be liable for any losses arising from the use of this information. Virtual asset investments carry high risks and are subject to significant price volatility. You may lose all of your invested principal. Please fully understand the relevant risks and make prudent decisions based on your own financial situation and risk tolerance. For details, please refer to
Disclaimer.
Related Articles
XRP Price Structure Tightens While Heatmap Highlights $1.30 Liquidity Zone
XRP trades near $1.37 support after a 0.9% daily decline, while the $1.44 level remains the immediate resistance in the current range.
A three-week liquidity heatmap highlights a large order cluster around $1.30, indicating a strong liquidity zone below price.
A three-month Gaussian
CryptoNewsLand7m ago
Billionaire Investor Stanley Druckenmiller Bullish on Stablecoin Growth
Billionaire investor Stanley Druckenmiller believes stablecoins will become the backbone of the financial system in 10-15 years, citing their efficiency. However, he views much of the wider crypto market as unnecessary, describing it as “a solution looking for a problem.”
Decrypt28m ago
SOL Consolidates Near $84 While Chart Highlights Possible $45 Demand Zone
Solana (SOL) trades at $83.87 within a range defined by $81.03 support and $84.43 resistance, showing consolidation below a $90 supply zone. There is a broader demand area near $45, indicating potential downward movement before recovery.
CryptoNewsLand1h ago
BTC 15分钟下挫0.63%:宏观数据打压风险偏好叠加ETF资金流出加剧抛压
2026-03-13 17:15 至 2026-03-13 17:30(UTC)期间,比特币(BTC)15分钟K线波动加剧,收益率录得-0.63%,报价在71600.0至72243.9 USDT之间,振幅达到0.89%。异动引发市场关注,订单薄压力显现,短线资金两极分化明显。
本次异动的主要驱动力来自宏观经济数据公布后市场风险偏好骤降以及ETF资金净流出。美国最新GDP数据下修至0.7%,远低于
GateNews1h ago
BTC 15分钟上涨0.62%:地缘冲突推升避险需求与链上资金共振驱动上行
2026-03-13 16:30 至 2026-03-13 16:45(UTC),BTC价格在71379.5 USDT至71870.0 USDT区间波动,15分钟内收益率录得+0.62%,振幅达到0.69%,带动市场关注度显著升温。短线资金活跃,波动节奏加快,显示市场避险情绪占据主导。
本次异动的主要驱动力是全球宏观地缘冲突升级引发油价飙升,触发传统风险资产普遍承压。美股等主流市场出现资金流出
GateNews1h ago
PEPE Consolidates Above $0.05324 Support as Momentum Strengthens and Resistance Near $0.05336 Holds
PEPE has a tight intraday price compression with a support level of $0.053243 and resistance level of $0.053363.
A RSI of 64.13 represents the moderate bullish momentum whereas MACD history is slightly positive, which indicates the gradual buying momentum.
The price is at $0.053364
CryptoNewsLand1h ago