Date: Tue, Dec 23, 2025 | 10:20 AM GMT
The broader cryptocurrency market continues to struggle with uneven and choppy price action, a phase that began following the sharp sell-off on October 10. That correction dragged Ethereum (ETH) lower by nearly 20% over the past 60 days, keeping risk appetite subdued across the altcoin space. Pump.fun (PUMP) has not been spared from this weakness, remaining firmly under selling pressure as market sentiment stays cautious.
PUMP is now down more than 57% over the past two months, and while volatility has eased slightly in recent sessions, the daily chart reveals a technical structure that strongly favors further downside rather than an immediate recovery.
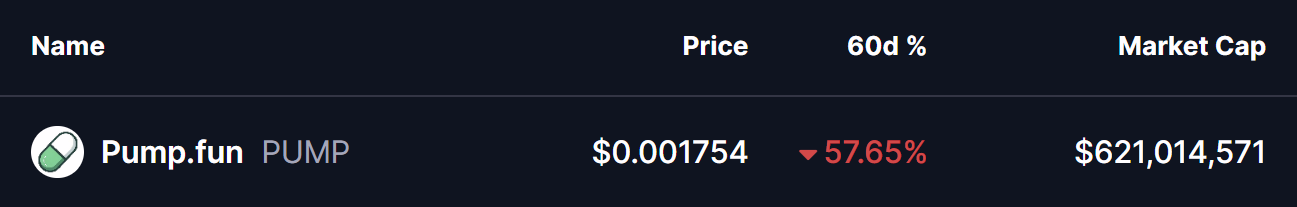
Source: Coinmarketcap
Head and Shoulders Breakdown Confirms Bearish Shift
On the daily timeframe, PUMP formed a textbook head and shoulders pattern — one of the most widely followed bearish reversal formations in technical analysis. The structure began to take shape in late August, with the left shoulder forming near the $0.004 area, followed by a sharp rally that pushed price to a higher peak, creating the head near $0.0095.
The right shoulder developed in early November, topping out around $0.00548 before momentum clearly faded. This failure to reclaim previous highs signaled growing weakness among buyers and set the stage for a breakdown.
As selling pressure increased, PUMP slid toward the neckline support near the $0.0035 zone — a level that had previously acted as a strong demand area. The chart shows that this support ultimately gave way, confirming the head and shoulders breakdown. Once price lost the neckline, downside momentum accelerated, driving PUMP toward the $0.00175 region.
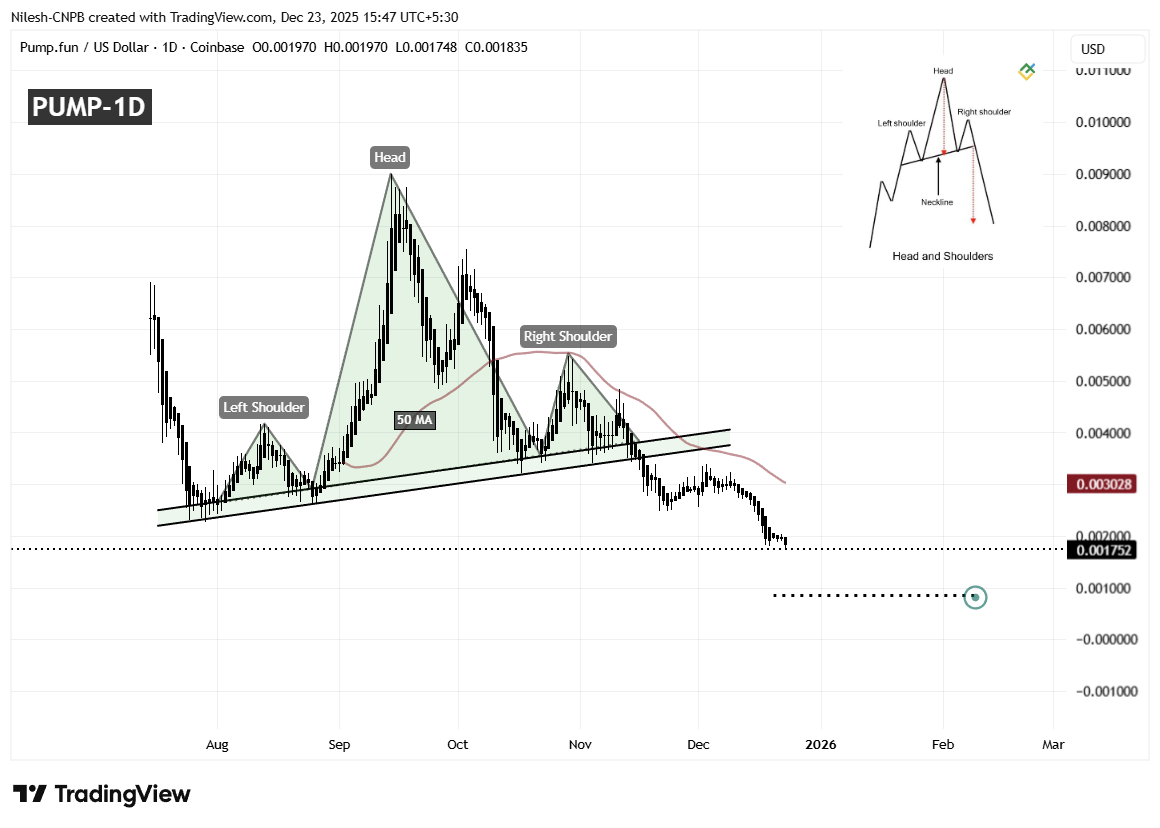
PUMP Daily Chart/Coinsprobe (Source: Tradingview)
This move represents a clear shift in market structure, with sellers firmly in control and bullish momentum largely exhausted.
What’s Next for PUMP?
With the breakdown now confirmed, attention turns to how PUMP behaves around former support levels. The $0.0035 neckline zone has flipped into resistance, and any relief bounce into this area that fails to reclaim it would likely reinforce the bearish outlook.
If downside pressure persists, the measured move from the head and shoulders pattern points toward a potential target near $0.00085. This level aligns with the projected breakdown objective and could act as a temporary pause point if selling accelerates further.
On the upside, a short-term relief rally cannot be ruled out, particularly if broader market conditions stabilize. A reclaim of the 50-day moving average near $0.003028 could trigger a bounce. However, even in that scenario, the overall structure would remain bearish unless PUMP can establish sustained acceptance above this level.
Until then, the trend favors caution, with sellers maintaining the upper hand and downside risks remaining elevated.
**Disclaimer: **The views and analysis presented in this article are for informational purposes only and reflect the author’s perspective, not financial advice. Technical patterns and indicators discussed are subject to market volatility and may or may not yield the anticipated results. Investors are advised to exercise caution, conduct independent research, and make decisions aligned with their individual risk tolerance.
Disclaimer: The information on this page may come from third parties and does not represent the views or opinions of Gate. The content displayed on this page is for reference only and does not constitute any financial, investment, or legal advice. Gate does not guarantee the accuracy or completeness of the information and shall not be liable for any losses arising from the use of this information. Virtual asset investments carry high risks and are subject to significant price volatility. You may lose all of your invested principal. Please fully understand the relevant risks and make prudent decisions based on your own financial situation and risk tolerance. For details, please refer to
Disclaimer.
Related Articles
NYDIG: The correlation between Bitcoin and tech stocks is overstated
According to the financial services company NYDIG, the recent similarity between Bitcoin and US software sector stocks mainly stems from both being affected by macroeconomic factors, rather than reflecting any structural convergence.
In the past week, the price of Bitcoin (BTC) has experienced sluggish growth.
TapChiBitcoin27m ago
Dogecoin, Pepe, and Shiba Inu Slide as Bitcoin Falls Below $70K
Bitcoin's drop below $70K triggers a selloff in meme coins like Dogecoin and Shiba Inu, causing increased market volatility. Despite a surge in Shiba Inu's burn activity, its price declines alongside Dogecoin, which struggles with weak momentum.
CryptoBreaking44m ago
Bitmine accelerated purchases last week with 60,976 ETH! Tom Lee: Ethereum is in the late stage of the "bear market," and the bottom could be seen as early as this week.
Ethereum reserve company Bitmine announced its holdings on March 9, accumulating 4.535 million ETH with total assets reaching $10.3 billion. Chairman Tom Lee stated that they have recently accelerated their purchase by 60,976 ETH and believe that Ethereum is currently in the late stage of a small bear market, with the bottom estimated between March 8 and 14. Bitmine has staked 3.04 million ETH, generating an annualized yield of $174 million, and plans to launch its own staking infrastructure, MAVAN.
動區BlockTempo1h ago
Ethereum Breakout Signals Short-Term Upside
The recent bullish sentiment in the crypto market is driven by Ethereum's breakout from a downward trendline, indicating potential price targets of $2,050 and $2,085. While the volatility remains, analysts are optimistic about Ethereum's long-term prospects contingent on market adoption.
Coinfomania1h ago
SXP Price Surges 11.59%: What This Could Mean for Traders
SXP has surged 11.59% amid a generally declining crypto market, reaching $0.0231. This increase reflects heightened investor interest, driven by market dynamics and trading activity, as traders eye key resistance and support levels.
Coinfomania1h ago
BitMine increased its holdings by 60,976 ETH last week. The Executive Chairman states that ETH may bottom out in mid-month.
BitMine announced that as of March 8, its total assets reached $10.3 billion, including 4,534,563 ETH and 195 BTC. Executive Chairman Tom Lee stated that amidst market uncertainty, ETH has shown resilience, and its price is expected to bottom out between March 8 and 14. Meanwhile, BitMine is accelerating its ETH accumulation, with staked ETH reaching 3,040,483.
GateNews1h ago