Date: Sat, Dec 20 2025 | 05:55 PM GMT
The broader cryptocurrency market has continued to struggle with uneven and choppy price action over the past several weeks, a phase that began after the sharp sell-off on October 10. That correction pushed Ethereum (ETH) lower by nearly 26% over the last 60 days, keeping sustained pressure across the altcoin market. Worldcoin (WLD) has been no exception, remaining under heavy selling pressure during this period.
WLD is down more than 44% over the past two months. While the short-term trend still leans bearish, the higher-timeframe chart is starting to show a structure that often appears near potential market turning points. If key technical levels are reclaimed, the current setup could evolve into a broader recovery attempt.

Source: Coinmarketcap
Power of 3 Pattern in Focus
On the higher-timeframe chart, WLD appears to be forming a classic Power of 3 structure, a pattern frequently associated with market cycle lows and trend transitions. This structure typically unfolds in three stages—accumulation, manipulation, and expansion—with the most decisive move usually emerging once the final phase begins.
Earlier, WLD spent an extended period moving sideways within a well-defined range between $0.6528 and $0.5628. This low-volatility environment, highlighted by the grey box on the chart, reflects the accumulation phase. During such phases, price action tightens, volatility fades, and longer-term participants often begin positioning quietly while broader sentiment remains weak or indifferent.
That stability eventually gave way as broader market pressure intensified. WLD broke below the $0.5628 support and slid to a recent low near $0.4721 before attempting a modest rebound. This sharp downside move aligns closely with the manipulation phase of the Power of 3 pattern. Such breakdowns are often designed to trigger stop-losses and force capitulation, shaking out weaker holders before price looks for a base.
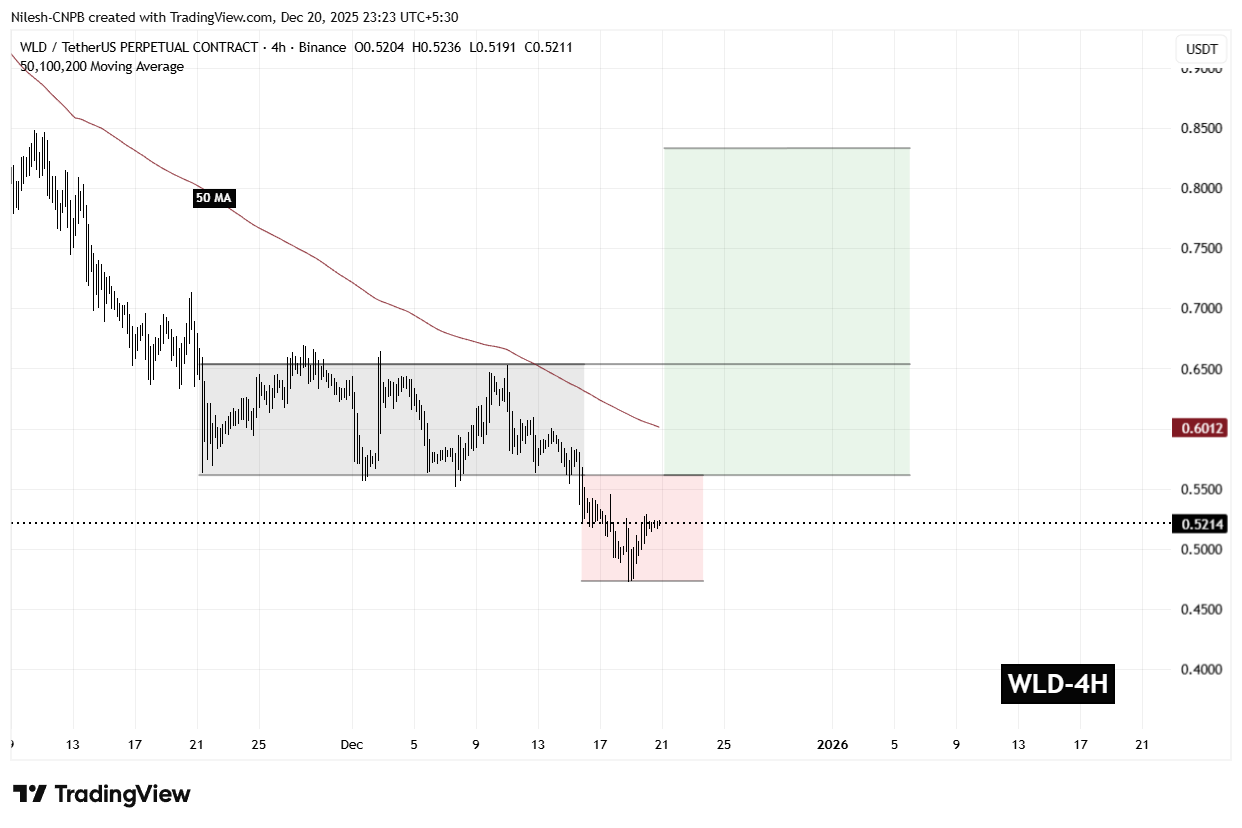
Worldcoin (WLD) 4H Chart/Coinsprobe (Source: Tradingview)
Notably, selling momentum has started to slow near this lower zone. Recent candles show reduced downside follow-through, suggesting that bearish pressure may be losing strength as price consolidates after the breakdown.
What’s Next for WLD?
At the time of writing, WLD continues to trade within the broader manipulation zone, which calls for caution. Price remains below the 50-period moving average near $0.6012, an area that now acts as an important short-term resistance. A sustained move back above this level would be an early signal that sellers are losing control.
For the bullish scenario to gain traction, WLD needs to reclaim both the $0.5628 level and establish acceptance above the $0.60–$0.65 resistance zone. A successful recovery into this former range would suggest that the manipulation phase has likely concluded and that the market may be transitioning toward the expansion phase of the structure.
If buyers manage to break and hold above $0.6528, the chart projection opens the door for a move toward the $0.83 region, which represents the measured expansion target and implies a potential upside of roughly 59% from current levels.
That said, this setup remains conditional. As long as WLD trades below $0.5628, downside risks cannot be ruled out, and the market remains vulnerable to further volatility. Holding recent lows and reclaiming key resistance levels will be critical for bulls looking to validate a bullish reversal narrative.
Disclaimer: The views and analysis presented in this article are for informational purposes only and reflect the author’s perspective, not financial advice. Technical patterns and indicators discussed are subject to market volatility and may or may not yield the anticipated results. Investors are advised to exercise caution, conduct independent research, and make decisions aligned with their individual risk tolerance.
Disclaimer: The information on this page may come from third parties and does not represent the views or opinions of Gate. The content displayed on this page is for reference only and does not constitute any financial, investment, or legal advice. Gate does not guarantee the accuracy or completeness of the information and shall not be liable for any losses arising from the use of this information. Virtual asset investments carry high risks and are subject to significant price volatility. You may lose all of your invested principal. Please fully understand the relevant risks and make prudent decisions based on your own financial situation and risk tolerance. For details, please refer to
Disclaimer.
Related Articles
ETH 15-minute increase of 0.96%: On-chain large-volume buying pressure intensifies amid macro and industry positive developments
From 00:15 to 00:30 on March 10, 2026 (UTC), the price of ETH increased by 0.96% within 15 minutes, with a price range of 1994.66 to 2015.21 USDT, and a volatility of 1.03%. During the same period, market trading activity was active, liquidity flows significantly increased, social attention rose, and volatility intensified.
The main driver of this ETH price fluctuation was the occurrence of multiple large buy orders on-chain. Institutional and large-scale investors concentrated their funds into mainstream trading platforms, with nearly 48,000 ETH in trading volume supporting the rapid price movement.
GateNews7m ago
Cryptocurrency Fear and Greed Index rises to 13 today, and the market remains in a state of extreme panic.
Gate News Report, March 10th, according to Alternative.me data, the cryptocurrency fear and greed index today is 13, up from yesterday's 8, but market sentiment remains in a state of "extreme fear."
GateNews23m ago
Trump says the war will end soon! Oil prices plummet, and the US stock market makes a surprising rebound
U.S. President Trump hinted that the Iran war will end quickly, leading to a rebound in the US stock market and a sharp drop in oil prices. Bitcoin retreated to 68K, and Ethereum is around 2000. MicroStrategy and BitMine continue to buy cryptocurrencies, and the Fear and Greed Index has risen. The market faces uncertainty, with the risk of a stock market crash rising to 35%.
ChainNewsAbmedia47m ago
Bitcoin Gets Its Own ‘Fear Gauge’ as Cboe Announces BITVX Index
Cboe Global Markets is bringing Wall Street’s favorite volatility playbook to bitcoin, announcing plans to launch a new index designed to track the market’s expected price swings using options tied to the popular Ishares Bitcoin Trust ETF.
BITVX: Cboe Applies VIX Methodology to Bitcoin ETF
Coinpedia3h ago
Strategy’s Michael Saylor Reveals $1.28B Bitcoin Purchase, Holdings Reach 738,731 BTC
Michael Saylor, executive chairman of Strategy, posted a brief but blunt update that stopped scrolling feeds: “Strategy has acquired 17,994 BTC for ~$1.28 billion at ~$70,946 per Bitcoin. As of 3/8/2026, we hodl 738,731 $BTC acquired for ~$56.04 billion at ~$75,862 per Bitcoin.” The numbers speak fo
BlockChainReporter3h ago
ETH 15-minute increase of 1.96%: On-chain large fund inflows and technical breakthroughs jointly amplify the rally
2026-03-09 19:15 to 19:30 (UTC), ETH achieved a short-term return of 1.96%, with the price range between 2010.14 and 2050.5 USDT, and an amplitude of 2.01%. Trading volume during this period significantly increased, market attention rapidly grew, and price fluctuations drew high investor interest.
The main driver of this movement was multiple large transfers of over 10,000 ETH on the blockchain, primarily flowing to a major exchange, indicating institutional or large investor accumulation, with positive capital inflows. At 19:15, ETH suddenly
GateNews5h ago