In December 2025, Memecoin fell to historical lows. Major tokens are registering good returns, which indicates a possible revival season.
The memecoin market is signaling life. Major tokens are registering gains after months of decrease. The end of December 2025 was a turning point in the sector.
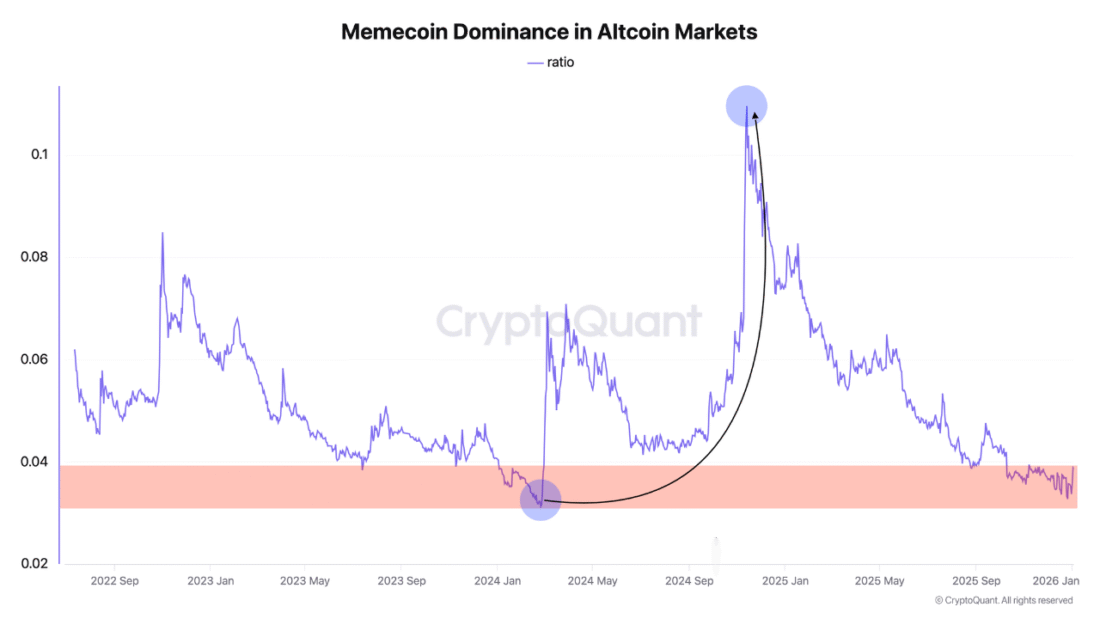
As CryptoQuant notes, the dominance of memecoins was at a historic low. In December 2025, the ratio decreased to 0.032, which is a mere 3.2 percent of the total market capitalization of altcoins.
Source:CryptoQuant
The Numbers Tell a Dramatic Story
At its climax in November 2024, they controlled 11% of the altcoins. That period’s ratio stood at 0.11. Dominance failed by 71 percent over the course of 13 months. The fall was inexorable and harsh, and it took a few people unawares.
CryptoQuant contrasted the market caps of major altcoins with the most popular memecoins. Their approach showed an obvious pattern: memecoin influence had been practically eliminated in crypto markets.
You might also like: Strategy Boosts Bitcoin Reserves with Latest 1,287 BTC Purchase
Why This Bottom Matters Now
History repeated itself the last time this level was present. The bottom was followed by a huge memecoin season. Traders monitor existing levels.
The recent days have been followed by new momentum. Major memecoins showed good returns across the board, and the volumes of trading were up significantly.
According to CryptoQuant, this may be a memecoin revival. Time is unpredictable and speculative, but there are positive indications of possible momentum creation.
The trend reflects past market cycles. Memecoin markets have been no exception to this pattern: extreme lows usually come before explosive rallies.
These signals are not going unnoticed by speculative investors. Risk management is still important at this stage, and one should be careful even when the signs are encouraging.
The ratio change has occurred in a series of days. Increases in gains were accelerated by growing strength in momentum, and market participants raised their memecoin allocations gradually.
Historical data support the comeback thesis: past rallies began at the bottom, and the current setup shows the same characteristics.
Turnover in altcoin dominance is usually an indicator of rotation. The money circulates through the already printed coins to the speculative assets, and memecoins usually take advantage of such turns.
Risk assets seem to be well-positioned in the market. The mood has been on the rise since the lows in December, and traders are speculating on upward trends.
The recovery is still in its nascent phases. It takes an upward trend to be confirmed. A few weeks of profits would be a stronger argument.
Investors manage memecoin volatility through portfolio diversification. Minor allocations reduce the exposure to downside risks and maximize the opportunity and appropriate risk management.
The memecoin industry has a track record of defying the naysayers. Past comebacks have provided fantastic returns to early entrants, and the present environment points to identical potential today.
Disclaimer: The information on this page may come from third parties and does not represent the views or opinions of Gate. The content displayed on this page is for reference only and does not constitute any financial, investment, or legal advice. Gate does not guarantee the accuracy or completeness of the information and shall not be liable for any losses arising from the use of this information. Virtual asset investments carry high risks and are subject to significant price volatility. You may lose all of your invested principal. Please fully understand the relevant risks and make prudent decisions based on your own financial situation and risk tolerance. For details, please refer to
Disclaimer.
Related Articles
XRP Price Structure Tightens While Heatmap Highlights $1.30 Liquidity Zone
XRP trades near $1.37 support after a 0.9% daily decline, while the $1.44 level remains the immediate resistance in the current range.
A three-week liquidity heatmap highlights a large order cluster around $1.30, indicating a strong liquidity zone below price.
A three-month Gaussian
CryptoNewsLand19m ago
Billionaire Investor Stanley Druckenmiller Bullish on Stablecoin Growth
Billionaire investor Stanley Druckenmiller believes stablecoins will become the backbone of the financial system in 10-15 years, citing their efficiency. However, he views much of the wider crypto market as unnecessary, describing it as “a solution looking for a problem.”
Decrypt40m ago
SOL Consolidates Near $84 While Chart Highlights Possible $45 Demand Zone
Solana (SOL) trades at $83.87 within a range defined by $81.03 support and $84.43 resistance, showing consolidation below a $90 supply zone. There is a broader demand area near $45, indicating potential downward movement before recovery.
CryptoNewsLand1h ago
BTC 15分钟下挫0.63%:宏观数据打压风险偏好叠加ETF资金流出加剧抛压
2026-03-13 17:15 至 2026-03-13 17:30(UTC)期间,比特币(BTC)15分钟K线波动加剧,收益率录得-0.63%,报价在71600.0至72243.9 USDT之间,振幅达到0.89%。异动引发市场关注,订单薄压力显现,短线资金两极分化明显。
本次异动的主要驱动力来自宏观经济数据公布后市场风险偏好骤降以及ETF资金净流出。美国最新GDP数据下修至0.7%,远低于
GateNews1h ago
BTC 15分钟上涨0.62%:地缘冲突推升避险需求与链上资金共振驱动上行
2026-03-13 16:30 至 2026-03-13 16:45(UTC),BTC价格在71379.5 USDT至71870.0 USDT区间波动,15分钟内收益率录得+0.62%,振幅达到0.69%,带动市场关注度显著升温。短线资金活跃,波动节奏加快,显示市场避险情绪占据主导。
本次异动的主要驱动力是全球宏观地缘冲突升级引发油价飙升,触发传统风险资产普遍承压。美股等主流市场出现资金流出
GateNews2h ago
PEPE Consolidates Above $0.05324 Support as Momentum Strengthens and Resistance Near $0.05336 Holds
PEPE has a tight intraday price compression with a support level of $0.053243 and resistance level of $0.053363.
A RSI of 64.13 represents the moderate bullish momentum whereas MACD history is slightly positive, which indicates the gradual buying momentum.
The price is at $0.053364
CryptoNewsLand2h ago