Bittensor (TAO) To Climb Higher? This Emerging Bullish Pattern Formation Suggests So!

Date: Sat, Jan 03, 2026 | 06:50 PM GMT
As 2026 kicks off, the broader cryptocurrency market is showing renewed stability. Ethereum (ETH) has reclaimed the $3,100 mark, and momentum is gradually spreading across major altcoins — including Bittensor (TAO).
TAO is trading around 3% higher on the day, extending its weekly gains to nearly 14%. While the short-term strength is encouraging, the more important development lies in the structure forming on the chart. Recent price action suggests a meaningful shift in market behavior — one that could signal the early stages of a bullish continuation if key levels are reclaimed.
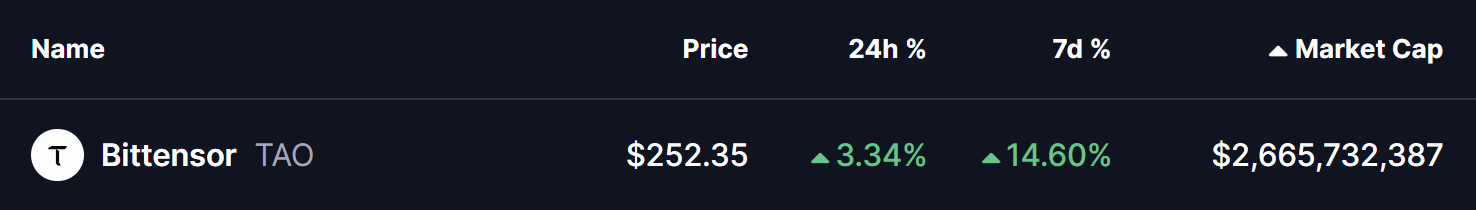
Source: Coinmarketcap
Rounding Bottom Pattern Takes Shape
On the 4-hour timeframe, Bittensor appears to be forming a rounding bottom pattern, a classic bullish reversal structure that typically develops after an extended corrective phase. This pattern reflects a gradual transition from distribution to accumulation, where selling pressure fades and buyers begin to step in more consistently.
The setup began after TAO faced a firm rejection near the $315 neckline resistance, which triggered a sharp decline through late November and December. That move eventually found strong demand near the $206 support zone, where selling momentum stalled. Multiple defenses of this level prevented any deeper breakdown and helped establish a solid base for a potential trend reversal.
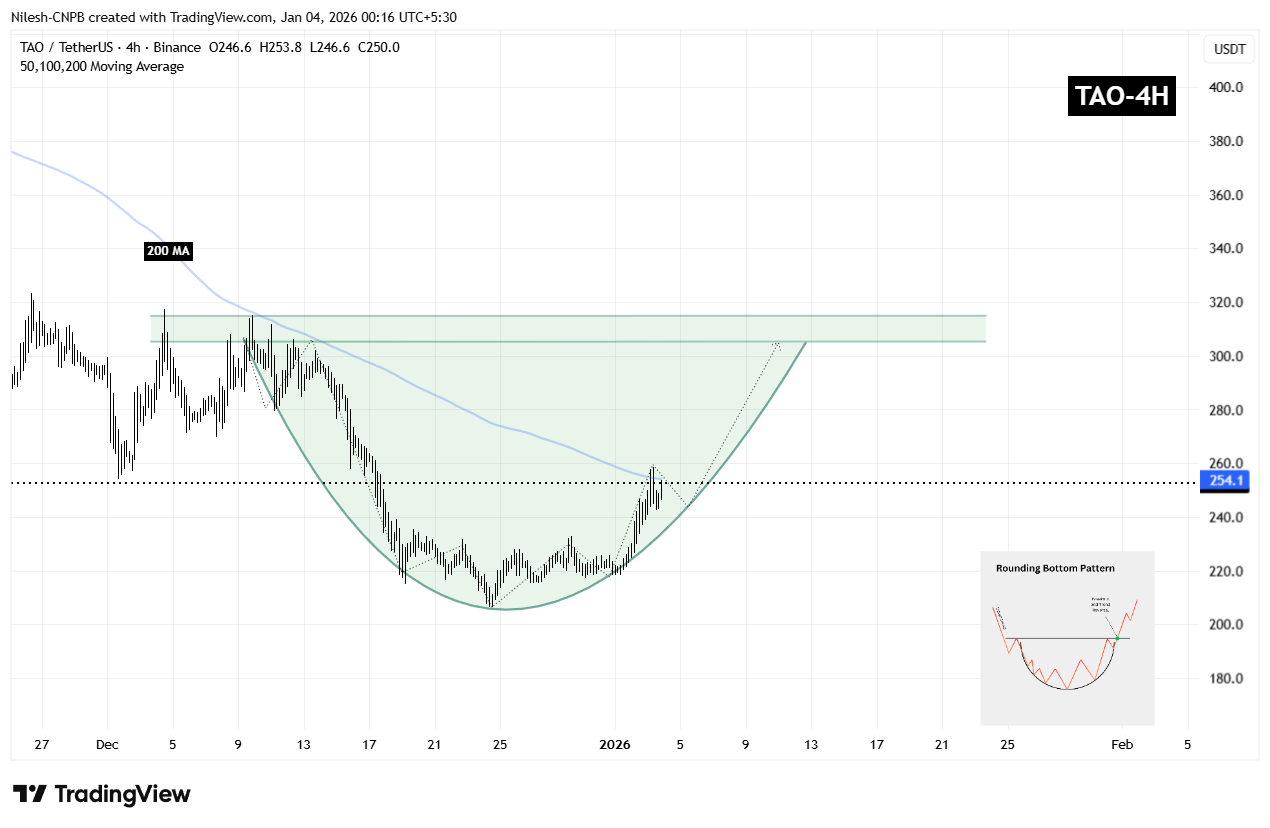
Bittensor (TAO) 4H Chart/Coinsprobe (Source: Tradingview)
Since carving out that bottom, TAO has started to curve higher in a smooth, rounded fashion — closely matching the textbook structure of a developing rounding bottom. The recent recovery has also brought price back toward the 200-period moving average near $254, a level that previously acted as resistance and is now being tested as potential support.
What’s Next for TAO?
If TAO manages to hold above the 200 MA, that level could act as short-term support and provide a foundation for further upside attempts. A clean breakout above the $315 resistance zone, followed by sustained acceptance above it, would validate the entire reversal structure and likely open the door for a broader bullish expansion phase, with momentum traders re-entering the market.
Until that breakout occurs, the pattern remains in development. Short-term consolidation or shallow pullbacks remain possible, particularly as price digests recent gains. However, as long as TAO continues to maintain higher lows above the established base, the broader bottoming structure remains intact and constructive.
For now, the chart suggests that TAO is approaching a critical confirmation phase — one that could determine whether this recovery evolves into a sustained bullish trend as the new year unfolds.
Disclaimer: The views and analysis presented in this article are for informational purposes only and reflect the author’s perspective, not financial advice. Technical patterns and indicators discussed are subject to market volatility and may or may not yield the anticipated results. Investors are advised to exercise caution, conduct independent research, and make decisions aligned with their individual risk tolerance.
About Author: Nilesh Hembade is the Founder and Lead Author of Coinsprobe, with over 5 years of experience in the cryptocurrency and blockchain industry. Since launching Coinsprobe in 2023, he has been providing daily, research-driven insights through in-depth market analysis, on-chain data, and technical research.
Related Articles
MSTR declines for 8 consecutive months without fear! Michael Saylor announces additional Bitcoin purchases and a 11.5% annualized dividend increase
Hyperliquid hides 28.9 million shorts liquidated, bulls and bears battle at the $35 level
Analysis: Bitcoin technical indicators show a death cross, previously warning of the "final market decline" in earlier cycles.
Middle East Geopolitical Shock: Analyzing Hedging Capital Flows and BTC Pricing Logic Through Options Data
U.S.-Iran Conflict » Analysts Say Bitcoin Bottoming Out, Market Focuses on Oil and U.S. Inflation Changes
Shiba Inu Faces Pressure as 531B SHIB Flood Exchanges