
**Date: **Wed, Jan 07, 2026 | 06:20 AM GMT
The broader cryptocurrency market continues to show strong New Year momentum, with Bitcoin (BTC) up around 4% and Ethereum (ETH) gaining over 9% on a weekly basis. This improving sentiment is gradually spilling over into major altcoins — including the DePIN-focused token Akash Network (AKT).
AKT has already posted an impressive 20% weekly gain. While this short-term strength has caught traders’ attention, the more important development is unfolding on the higher-timeframe chart. Recent price action suggests a meaningful shift in market structure, hinting that AKT may be transitioning out of a prolonged corrective phase and into the early stages of a bullish continuation.

Source: Coinmarketcap
Falling Wedge and Rounding Bottom in Play
On the daily chart, AKT has been trading within a broader falling wedge — a structure that often precedes bullish reversals as selling pressure gradually weakens. Within this larger wedge, price action is also shaping a developing rounding bottom pattern, reflecting steady accumulation and seller exhaustion.
The formation began after AKT faced strong rejection near the $0.5441 resistance zone in late November. That rejection triggered a sharp sell-off, pushing price lower toward the $0.3465 region. However, bears failed to extend losses beyond this area. Instead, demand stepped in, downside momentum slowed, and price began to stabilize.
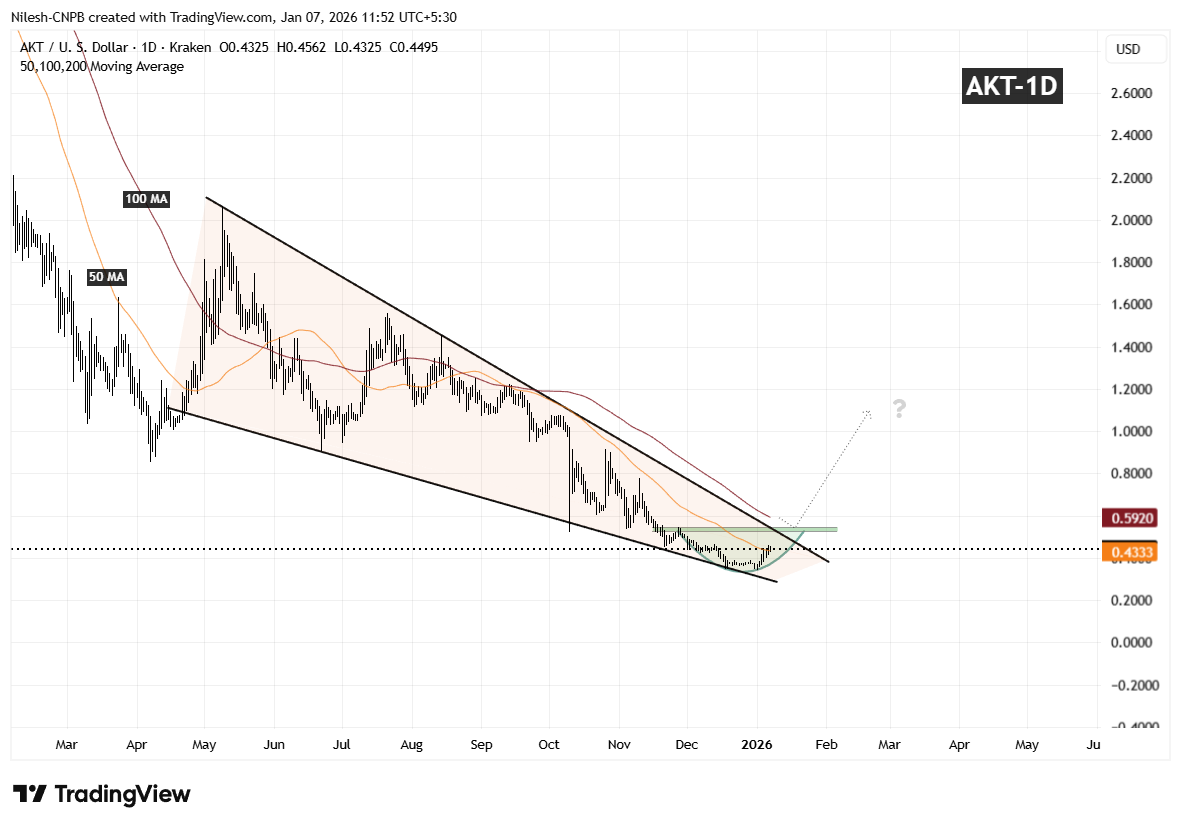
Akash Network (AKT) Daily Chart/Coinsprobe (Source: Tradingview)
Over the following weeks, volatility compressed and AKT started to curl higher in a smooth, rounded fashion — closely matching the textbook behavior of a rounding bottom. Importantly, the recent rebound has pushed price back above the 50-day moving average around $0.4333, a level that had previously acted as resistance and is now beginning to flip into support.
What’s Next for AKT?
If AKT can continue to hold above the 50-day moving average, this area may act as a solid base for further upside attempts. From here, attention shifts toward the descending resistance trendline of the falling wedge, which aligns closely with the $0.5441 resistance zone.
A clean and decisive breakout above this confluence area, followed by sustained acceptance, would confirm a broader bullish expansion phase and mark a clear trend reversal from the prior downtrend. Such a move would likely attract renewed momentum participation as the market recognizes the structural shift.
Until that breakout occurs, the pattern remains in development. Short-term consolidation or shallow pullbacks are still possible as price digests recent gains. However, as long as AKT continues to print higher lows above the established base, the broader technical structure remains constructive.
Overall, the chart suggests AKT is approaching a critical inflection point — one that could determine whether this recovery evolves into a sustained bullish trend as 2026 progresses.
Disclaimer: The views and analysis presented in this article are for informational purposes only and reflect the author’s perspective, not financial advice. Technical patterns and indicators discussed are subject to market volatility and may or may not yield the anticipated results. Investors are advised to exercise caution, conduct independent research, and make decisions aligned with their individual risk tolerance.
About Author: Nilesh Hembade is the Founder and Lead Author of Coinsprobe, with over 5 years of experience in the cryptocurrency and blockchain industry. Since launching Coinsprobe in 2023, he has been providing daily, research-driven insights through in-depth market analysis, on-chain data, and technical research.
Disclaimer: The information on this page may come from third parties and does not represent the views or opinions of Gate. The content displayed on this page is for reference only and does not constitute any financial, investment, or legal advice. Gate does not guarantee the accuracy or completeness of the information and shall not be liable for any losses arising from the use of this information. Virtual asset investments carry high risks and are subject to significant price volatility. You may lose all of your invested principal. Please fully understand the relevant risks and make prudent decisions based on your own financial situation and risk tolerance. For details, please refer to
Disclaimer.
Related Articles
DEGO (Dego Finance) has increased by 57.73% in the past 24 hours, now trading at $0.63
Gate News Update, March 09: According to CoinMarketCap data, as of press time, DEGO (Dego Finance) is trading at $0.63, up 57.73% in the past 24 hours, with a high of $0.67 and a low of $0.25. The 24-hour trading volume reached $89 million. The current market capitalization is approximately $13.3 million, an increase of $4.88 million from yesterday. ## Important recent news about DEGO: The 57.73% surge in DEGO's price, combined with the sharply increased trading volume of $89 million, indicates a clear market-driven capital influx. The significant price fluctuations between $0.25 and $0.67 reflect the market participants' sentiment.
GateNews1h ago
Bitcoin drops below 66,000, $340 million in liquidation, oil prices surge boosting the strong dollar: Fear Index remains at only 8
Bitcoin has fallen from its high of $68,200 to $66,323; Ethereum also declined to $2,073. In the past 24 hours, futures liquidations reached $342 million, and the market fear index dropped to 8, indicating extreme panic. Rising oil prices have boosted the US dollar, affecting the valuation of risk assets. Asian stock markets also generally declined, and the market is facing a consolidation vacuum period.
動區BlockTempo1h ago
Why did Bitcoin drop today? Oil prices surged 20%, and the Hormuz crisis dragged down the crypto market.
U.S. futures market oil prices surged to $113.7 due to Iran's threat to block the Strait of Hormuz, sparking global energy supply concerns, leading to Bitcoin's fourth consecutive decline to around $65,725. Risk aversion sentiment increased, coupled with rising energy costs suppressing risk appetite, prompting investors to withdraw. Bitcoin's technical support levels are between $62,000 and $64,000; if broken, further declines may occur.
MarketWhisper1h ago
XRP’s Billions in Dormant Liquidity Highlight Untapped Payment Potential Across XRPL
XRP is gaining renewed bullish momentum as growing attention around XRP Ledger utility and the RLUSD stablecoin fuels optimism that the network could potentially evolve into a powerful engine for everyday global payments.
XRP and RLUSD May Drive Next Phase of Blockchain Payments as XRPL
Coinpedia1h ago
Cryptocurrency Fear and Greed Index drops to 8, market enters extreme fear mode
Gate News Report, March 9th, according to Alternative.me data, the cryptocurrency Fear and Greed Index dropped to 8 today, further down from yesterday's 12, indicating an intensification of the "extreme fear" in the market.
GateNews2h ago
BTC 15-minute decline of 1.40%: Capital outflow and technical breakdown resonate, intensifying selling pressure
On March 8, 2026, from 22:00 to 22:15 (UTC), BTC rapidly declined within the range of 65,682.6 to 67,017.0 USDT, recording a -1.40% return with an amplitude of 1.99%. Short-term trading volume significantly increased, indicating intensified capital speculation, continued market attention, and rising fear sentiment, which further elevated volatility.
The main driving forces behind this anomaly are the increased outflows of funds from on-chain and ETF markets, as well as technical sell-offs following the breach of key support levels. During the reporting period, the trading volume of large whale transactions in BTC plummeted by 72% over two weeks, and long-term on-chain holders
GateNews4h ago