
**Date: **Fri, Jan 02, 2026 | 03:10 PM GMT
The broader cryptocurrency market has started the new year with modest strength, as both Bitcoin (BTC) and Ethereum (ETH) trade firmly in the green with gains of over 2%. While this positive momentum is lifting most altcoins, the privacy-focused token Zcash (ZEC) is moving against the broader trend.
ZEC is down more than 8% on the day. However, despite the red candles, the daily chart suggests this pullback may be a healthy bullish retest rather than the start of a trend reversal.
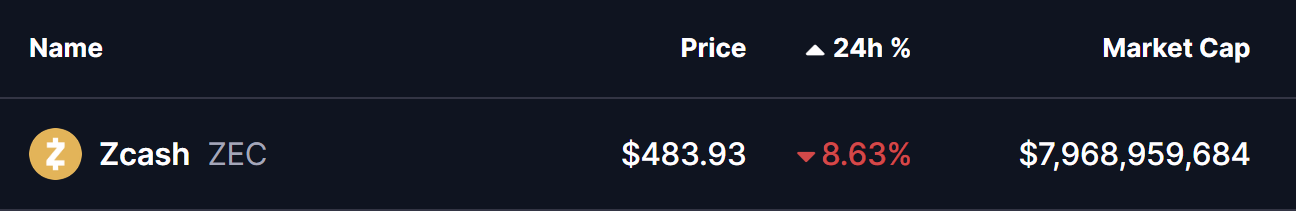
Source: Coinmarketcap
Retesting the Ascending Triangle Breakout
On the daily timeframe, ZEC had been consolidating inside a well-defined ascending triangle pattern, characterized by a series of higher lows pressing against a flat resistance zone near $476. This structure signaled steady accumulation and growing buyer confidence.
Earlier, bulls successfully broke above the $476 ceiling with strong momentum, sending ZEC sharply higher by nearly 66% — from the breakout base to a local peak around $556.59. This move confirmed the validity of the pattern and marked a clear shift in market structure.
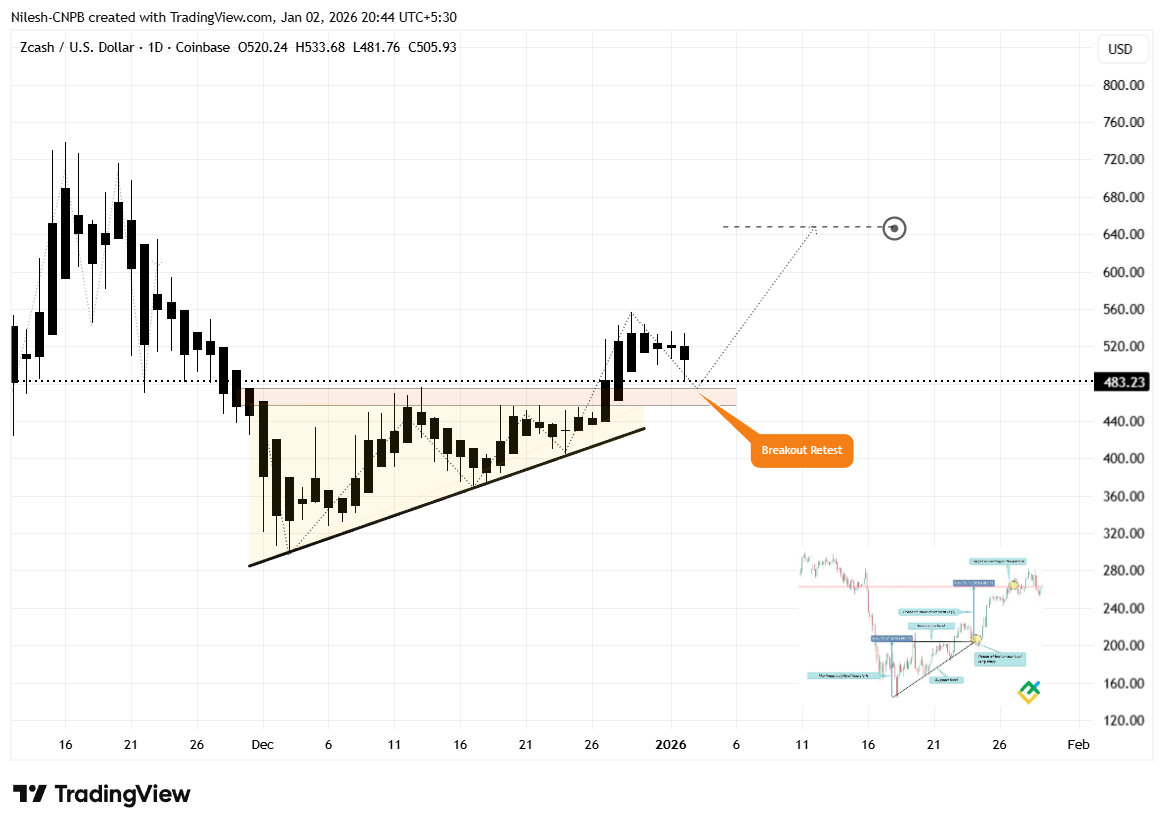
Zcash (ZEC) Daily Chart/Coinsprobe (Source: Tradingview)
Following that rally, price has pulled back and is now trading near the $483 region. Crucially, this zone aligns closely with the former breakout level, making it a classic resistance-turned-support area. Such retests are common after strong breakouts and often act as a launchpad for the next leg higher if buyers defend the level.
What’s Next for ZEC?
The current retest phase is technically constructive, but the next move will depend on whether bulls can firmly defend the broader $426–$476 support zone. A strong reaction from this area would signal that buyers remain in control and are using the dip to accumulate.
If support holds and momentum returns, ZEC’s first key objective will be a reclaim of the $556.59 local high. A decisive move above this level would confirm strength and open the door for further upside.
In that scenario, ZEC could advance toward the ascending triangle’s measured target near $647.73, representing a potential upside of roughly 32% from current levels.
On the downside, failure to hold above the $426 support zone would weaken the bullish breakout structure and raise the risk of a deeper pullback, potentially turning the recent move into a failed breakout.
For now, all eyes remain on the breakout retest. How ZEC reacts around this key support area will likely determine whether the recent rally was just the beginning — or a move that needs more time to rebuild momentum.
Disclaimer: The views and analysis presented in this article are for informational purposes only and reflect the author’s perspective, not financial advice. Technical patterns and indicators discussed are subject to market volatility and may or may not yield the anticipated results. Investors are advised to exercise caution, conduct independent research, and make decisions aligned with their individual risk tolerance.
About Author: Nilesh Hembade is the Founder and Lead Author of Coinsprobe, with over 5 years of experience in the cryptocurrency and blockchain industry. Since launching Coinsprobe in 2023, he has been providing daily, research-driven insights through in-depth market analysis, on-chain data, and technical research.
Disclaimer: The information on this page may come from third parties and does not represent the views or opinions of Gate. The content displayed on this page is for reference only and does not constitute any financial, investment, or legal advice. Gate does not guarantee the accuracy or completeness of the information and shall not be liable for any losses arising from the use of this information. Virtual asset investments carry high risks and are subject to significant price volatility. You may lose all of your invested principal. Please fully understand the relevant risks and make prudent decisions based on your own financial situation and risk tolerance. For details, please refer to
Disclaimer.
Related Articles
Ethereum Approaches Cycle Low as Bitmain Indicates Violent Belief
The article explores Ethereum's potential market bottom, highlighting its correlation with past S&P 500 trends and significant institutional investment by Bitmain. Despite mixed market sentiment, historical patterns suggest possible recovery.
CryptoBreaking58m ago
Analyst: If Bitcoin falls below the $66,000 support level, it may trigger a 10%-20% correction
Gate News reported that on March 20, Chartered Market Technician (CMT) Aksel Kibar stated on March 21 that the lower support boundary of Bitcoin's potential rising wedge formation is located at 66,000, and a breakdown below this level could trigger a bearish reversal. Aksel Kibar pointed out that rising wedges, as a classic technical pattern, typically appear at the end of uptrends, signaling price momentum exhaustion. Historical data shows that after similar downside breakdowns are confirmed, the average pullback ranges from 10%-20%.
GateNews2h ago
Bitcoin Slips Below $70,000 as Fed Rate Pause and Oil Surge Pressure Markets
Bitcoin declined to $70,000 due to steady interest rates from the Federal Reserve and rising energy prices, leading to $600 million in liquidations and increased market volatility, particularly affecting altcoins.
CryptoBreaking3h ago
XRP Climbs 3% Past $1.47 as Breakout Extends on Bitcoin-Led Rally
Key Takeaways
XRP broke above $1.426 resistance after months of consolidation, jumping to $1.47 on surging volume
Trading volume spiked over 250% during the move, indicating strong participation in the breakout
Activity on the XRP Ledger continues climbing, with tokenized real-world assets
CryptoBreaking3h ago
BTC down 0.65% in 15 minutes: Large spot selling orders dominate short-term pullback, panic sentiment intensifies volatility amplification
2026-03-20 13:45 to 2026-03-20 14:00 (UTC), BTC declined 0.65% within 15 minutes, with price range fluctuating between 69795.3 to 70399.4 USDT, reaching an amplitude of 0.86%. Market volatility intensified in the short term, trading activity increased, and investor attention rose.
The main driver of this price movement was concentrated large-scale active selling in the spot market. During this period, major trading platforms saw multiple large sell orders exceeding 100 BTC each, with sell orders accounting for 52% of volume, directly driving prices downward.
GateNews4h ago
