Nick Valdez (Deezy), a stake pool operator and prominent market analyst, expects Cardano to target the 100-day moving average next.
Key Points
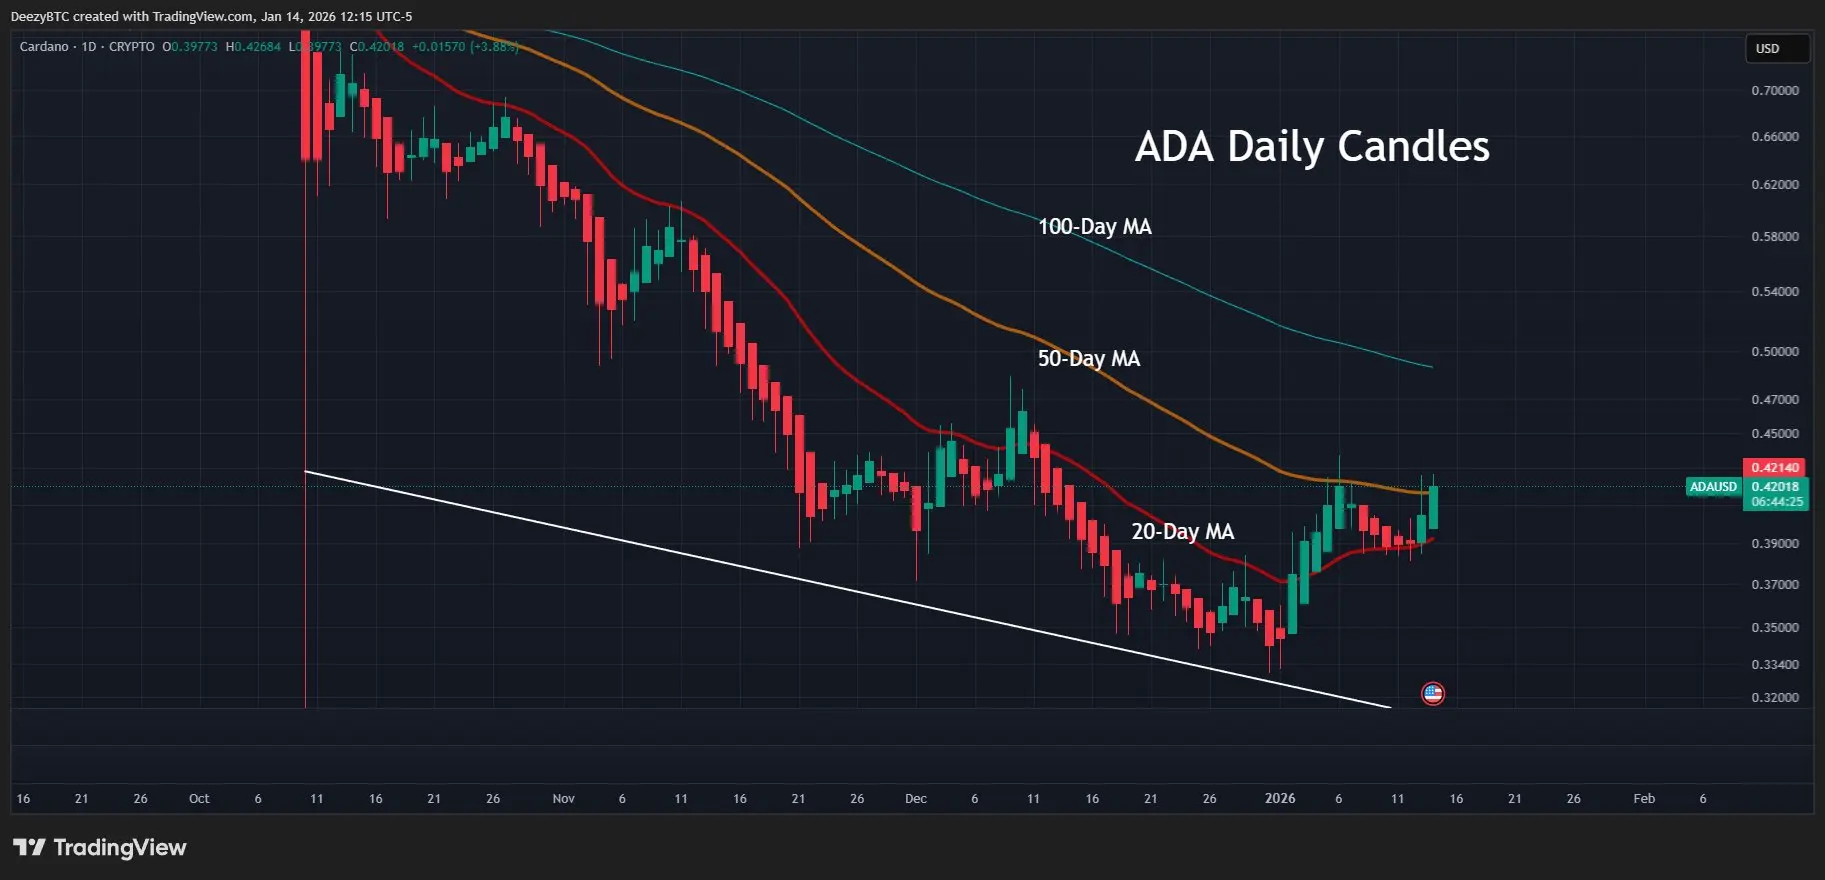
- Deezy, a stake pool operator and prominent market analyst, sees Cardano targeting the 100-day moving average next, which currently sits at $0.489.
- He pointed out that ADA bounced from the 20-day MA and has “tentatively” broken above the 50-day MA, making the 100-day MA its next key target.
- Cardano retested the 20-day moving average after its early January recovery run and regained bullish momentum, surging 9% the next day to reach $0.425.
- The run saw it break above the 50-day moving average.
- Deezy suggested the correctional phase for Cardano might be nearing its end, citing a higher-low formation on the daily chart.
Cardano and the 20D and 50D Moving Averages
For perspective, Cardano retested the 20-day moving average after its early January recovery run. The coin jumped to a high of $0.435 on January 6 but lost steam there, leading to a retracement that found support at the 20D MA around $0.380 on January 12.
From the area, Cardano regained bullish momentum, surging 9% the next day to reach $0.425. Notably, the run saw it break above the 50-day moving average, with Deezy suggesting it may have also defied this key indicator.
At the time of writing, ADA has retraced to $0.403, with current consolidation pushing it towards the 50-day at $0.395. Notably, if the indicator provides support, as the 20-day MA did a few days ago, Cardano may recover to a higher price level.
ADA Now Eyes the 100-day MA
Meanwhile, Deezy’s analysis highlighted the 100-day moving average as the next possible target. At the time of writing, this indicator stands at $0.489.
However, ADA has the $0.43 resistance level to overcome first. The cryptocurrency has faced selling pressure around the area twice this month, falling from the zone on January 6 and again on January 14, when its bullish momentum stalled at $0.426.
End of Cardano Downtrend? Caveats to Note
Further, Deezy suggested that the correctional phase for Cardano might be nearing its end, citing a higher low formation on the daily chart. An accompanying chart shows that the SPO views the consolidation from the January 6 high to a low of $0.38 to retest the 20D MA as a swing low before the next leg up.
 Cardano Analysis/DeezyIf this proves true, the analyst highlights $0.49 as the possible short-term target. However, this hinges on several factors, including sustained strength amid the current mild consolidation.
ADA needs to hold the 50-day MA if there is any chance of a further price increase, which is not guaranteed. Even if this level holds, reaching the 100-day MA also remains speculative, as market trends are unpredictable.
Disclaimer: The information on this page may come from third parties and does not represent the views or opinions of Gate. The content displayed on this page is for reference only and does not constitute any financial, investment, or legal advice. Gate does not guarantee the accuracy or completeness of the information and shall not be liable for any losses arising from the use of this information. Virtual asset investments carry high risks and are subject to significant price volatility. You may lose all of your invested principal. Please fully understand the relevant risks and make prudent decisions based on your own financial situation and risk tolerance. For details, please refer to
Disclaimer.
Related Articles
BTC 15-minute rise of 0.60%: ETF capital inflows and technical breakout resonance drive short-term momentum
2026-03-13 12:45 to 2026-03-13 13:00 (UTC), BTC achieved a +0.60% return within 15 minutes, with a price range of 72341.6-72888.0 USDT and a volatility amplitude of 0.76%. Short-term price oscillations noticeably intensified. Due to abundant trading volume, market attention rose rapidly, reflecting a phase of strengthened buying power.
The primary drivers of this movement are continuous net inflows into ETFs and a technical breakout of key structures. In March 2026, BTC spot ETFs attracted capital inflows as high as 1.6 billion dollars in a single week.
GateNews31m ago
DeFi enters a "winter of yields": liquidity stagnation, leverage contraction, and the disappearance of arbitrage opportunities
The DeFi market entered an "interest rate winter" since September 2025, with deposit rates for major stablecoins declining sharply and supply-demand imbalances causing liquidity congestion. The rate decline reflects reduced capital demand and a lack of high-return opportunities. Stablecoin lending demand has dropped significantly, with market risk appetite shifting toward more stable investment channels. In response to this situation, the Sky protocol demonstrates competitiveness and adaptability by introducing real-world assets to enhance yields. The low interest rates during this phase can be viewed as an opportunity for DeFi market transformation.
区块客35m ago
"Seeking a Sword by Marking a Boat" - Style Coin Price Predictions Go Viral: The Practical Logic and Flaws of Mystical Prophecies
Author: Frank, PANews
Whenever the market enters a confusing phase of going nowhere, people try to use a "cutting the boat to seek the sword" method of historical retrospection to predict the next market movement. In such cases, people often see from these theories and charts that history always repeats itself, and seem to automatically overlay and verify future price movements with a certain period in the past.
This coincidence seems to have a magical effect and is often verified. Some bloggers claim this prediction method has an accuracy rate of 75%~80%.
Does this "cutting the boat to seek the sword" style price prediction that repeatedly goes viral on social media help the market identify stages, or is it just packaging noise as prophecy?
From "Tick Fractals" to "History Rhyming"
The peak operation regarding predictions of October 2025 market tops is an analyst named CryptoBullet, who created a method called "ti
区块客39m ago
Surviving Oscillating Markets: How Retail Investors Can Minimize Losses? Capital Flow Trends and Practical Guide
Author: MyToken
In the crypto market, sentiment often emerges more easily than logic. When "volatility" becomes the norm for the broader market and "anxiety" becomes the prevailing mindset among retail investors, a discussion on how to "lose less money" carries more practical significance than any macro narrative presentation.
Recently, the renowned data aggregation platform MyToken hosted an AMA event themed "In the Current Market, How Can Retail Investors Lose Less Money? Capital Flow and Practical Guide." The event invited independent trader BTC Bull Demon King and KTX Exchange CMO Christine, who provided puzzled investors with a practical "survival guide" from the perspectives of independent traders and trading platforms respectively.
Below is a highlight recap of this AMA.
---
Market Phase Consensus: Stop Fantasizing About a Bull Run, This is a "Consolidation Phase"
Market positioning is a relatively important issue, as it directly determines the next
PANews2h ago
NAV Price Surges 44.25%: Is a New Trend Emerging?
NAV coin recently surged by 44.25%, reaching $0.032715, amid increased trading activity and fluctuating market conditions. Analysts attribute this rally to rising on-chain activity and shifting sentiment toward altcoins, while traders monitor key price levels for future movements.
Coinfomania3h ago
Why TARA Just Skyrocketed 24.47% in 60 Minutes
TARA's price surged 24.47% to $0.000047 amid mixed signals in the crypto market and increased trading activity. Market conditions and macroeconomic factors are influencing investor sentiment, with traders closely monitoring key resistance and support levels.
Coinfomania3h ago