
Key Highlights
-
Litecoin (LTC) price has declined nearly 21% in the past 60 days, but its long-term structure remains intact.
-
Weekly and monthly charts show Litecoin closely mirroring Monero’s (XMR) historical bullish fractal.
-
Both LTC and XMR peaked in 2017 and 2021 and formed macro higher lows after the 2022 bear market bottom.
-
LTC is currently testing a long-term rising support trendline near the $75 region.
-
If the fractal continues to play out, Litecoin could be setting up for a larger upside move.
Litecoin (LTC) may have struggled in the short term, but zooming out tells a far more interesting story.
Over the past 60 days, LTC has slipped roughly 21%, reflecting broader market hesitation and declining momentum. However, beneath this pullback, Litecoin’s higher-timeframe structure is beginning to resemble Monero’s (XMR) long-term bullish setup—a fractal that has caught the attention of several analysts.
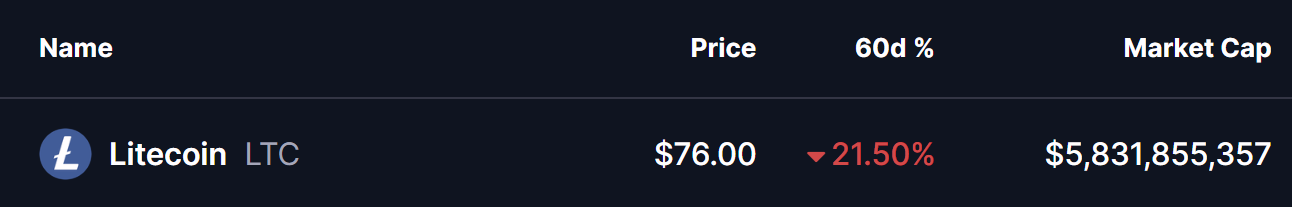
Source: Coinmarketcap
The comparison suggests that Litecoin could be quietly positioning itself for a larger move, similar to what Monero has already started to deliver.
Litecoin and Monero: A Fractal Years in the Making
According to a weekly chart shared by crypto analyst CryptoBullet, Litecoin’s structure closely mirrors Monero’s historical price behavior across multiple market cycles.
Both assets:
-
Peaked during the same periods in 2017 and again in 2021
-
Printed slightly higher highs during the 2021 cycle
-
Formed macro higher lows following the 2022 bear market bottom
This is a critical observation. Since the 2022 lows, Litecoin has displayed relative strength, maintaining a structure that aligns almost step-by-step with XMR’s longer-term bullish path. Monero has already begun breaking higher from this formation, which raises the question: Is Litecoin simply lagging behind?

XMR and LTC Weekly Fractal Chart/Credits: @CryptoBullet1 (X)
Fractal patterns like these don’t guarantee identical outcomes, but they often highlight market psychology, especially when two assets have matured through multiple cycles.
Monthly Chart Signals: Long-Term Support in Focus
On the monthly timeframe, analyst @_CryptoSurf highlights another important similarity.
Litecoin is currently testing its long-term rising support trendline near the $75 region, the same structural zone that historically marked accumulation phases during prior cycles. This mirrors Monero’s own behavior before its recent upside expansion.
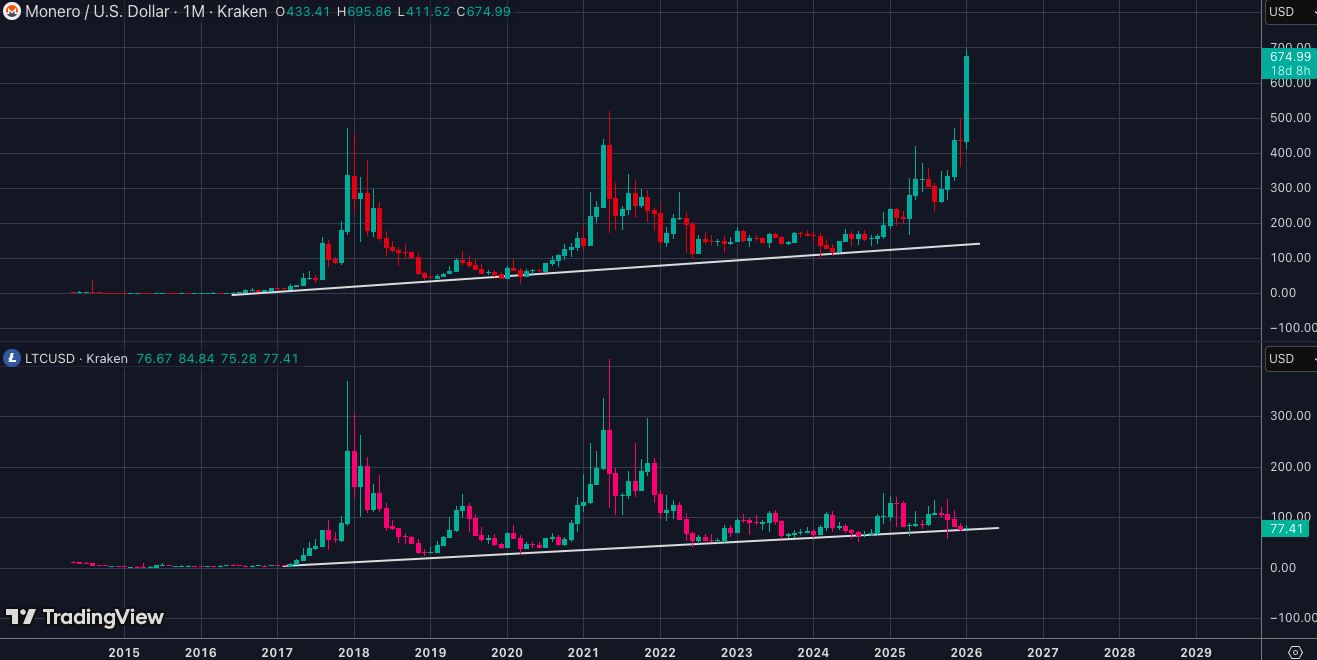
_XMR and LTC Monthly Fractal Chart/Credits: @CryptoSurf (X)
As long as this trendline holds, Litecoin’s broader structure remains intact. Prolonged consolidation at macro support often precedes volatility expansion, particularly when supply pressure dries up after extended drawdowns.
What Could Come Next for Litecoin (LTC)?
If the fractal comparison continues to play out, Litecoin may be approaching the later stages of its base formation.
Monero’s breakout followed:
For Litecoin, a similar roadmap would imply that the current consolidation phase could be a prelude to an upside rally, rather than a sign of weakness. The upper long-term trendline—currently far above price—stands out as the next major technical magnet if bullish momentum returns.
That said, structural support around $75 remains critical. Losing this level would weaken the fractal comparison and delay any bullish scenario.
Bottom Line
Despite recent downside pressure, Litecoin’s higher-timeframe structure suggests the correction may be part of a broader accumulation phase. The strong fractal similarity with Monero’s bullish path indicates that LTC could be lagging rather than weakening. As long as the $75 macro support holds, Litecoin may be positioning itself for a potential breakout in the coming cycle.
Frequently Asked Questions (FAQ)
Is Litecoin following Monero’s bullish price pattern?
Yes, Litecoin’s weekly and monthly charts show a strong fractal similarity to Monero, including shared cycle highs in 2017 and 2021 and a macro higher low formed after the 2022 bear market.
Why is the $75 level important for Litecoin?
The $75 region aligns with Litecoin’s long-term rising support trendline. Holding this level keeps the bullish higher-timeframe structure intact.
Disclaimer: The views and analysis presented in this article are for informational purposes only and reflect the author’s perspective, not financial advice. Technical patterns and indicators discussed are subject to market volatility and may or may not yield the anticipated results. Investors are advised to exercise caution, conduct independent research, and make decisions aligned with their individual risk tolerance.
About Author: Nilesh Hembade is the Founder and Lead Author of Coinsprobe, with over 5 years of experience in the cryptocurrency and blockchain industry. Since launching Coinsprobe in 2023, he has been providing daily, research-driven insights through in-depth market analysis, on-chain data, and technical research.
Disclaimer: The information on this page may come from third parties and does not represent the views or opinions of Gate. The content displayed on this page is for reference only and does not constitute any financial, investment, or legal advice. Gate does not guarantee the accuracy or completeness of the information and shall not be liable for any losses arising from the use of this information. Virtual asset investments carry high risks and are subject to significant price volatility. You may lose all of your invested principal. Please fully understand the relevant risks and make prudent decisions based on your own financial situation and risk tolerance. For details, please refer to
Disclaimer.
Related Articles
SHIB Price Struggles as Long Liquidations Surge Amid Volatility
Key Insights
The Shiba Inu saw long liquidations dominate recent activity as price reversed quickly, catching bullish traders off guard during a short-lived recovery phase.
Open interest rebounded sharply after a decline, signaling renewed trader engagement and expectations of stronger price
CryptoNewsLand30m ago
K33 Research: Bitcoin Enters Bottom-Building Phase, Market Gradually Shakes Off Selling Pressure
Bitcoin has recently been oscillating between $60,000 and $75,000, with reduced selling pressure in the market. Spot ETF inflows have turned positive, indicating a possible market bottom formation. Long-term holders' reluctance to sell is also strengthening price support. However, macroeconomic uncertainty remains, impacting market sentiment.
動區BlockTempo31m ago
Cardano Holds Near Key Support as Weak Data Signals Further Pressure
Key Insights
Cardano trades near $0.25 after a weekly decline, while geopolitical tensions and weak market sentiment continue to reduce investor confidence and participation.
Open interest and funding rates signal bearish positioning, as declining participation and negative rates reflect
CryptoNewsLand34m ago
Cardano Holds $0.26 as Regulators Clarify Crypto Rules
Key Insights:
Cardano holds steady near $0.26 as macro pressures and regulatory clarity shape short-term sentiment across digital asset markets globally.
Joint SEC and CFTC guidance reduces uncertainty, defining asset classifications and influencing investor expectations around crypto regula
CryptoNewsLand1h ago
Bittensor Price Jumps Above $300 After Nvidia CEO Remarks
Key Insights:
The Bittensor price surged over 20% in 24 hours, crossing $300 after Nvidia CEO remarks boosted confidence in decentralized AI adoption.
Trading volume exceeded $677 million, marking the highest level since November and signaling strong participation and improving liquidity
CryptoNewsLand1h ago
Viewpoint: Bitcoin Constrained Below $72,000, Four On-Chain Indicators Show Weakening Demand
Bitcoin price continues to remain below $72,000, with weakening market demand as investors begin to sell off positions, limiting short-term upside potential. On-chain activity and mining hash rate are declining, miner profitability is weakening, and market concerns about miner sell-offs are intensifying.
BlockBeatNews1h ago
