The correction of Bitcoin (BTC) is struggling to find support around the 92,000 USD region, as the bears remain persistent in tightening selling pressure. In an interview with Cointelegraph, some cryptocurrency analysts warn that the risk of escalating trade tensions between the US and the European Union could trigger a wave of “risk aversion,” casting a shadow over the entire market sentiment.
This instability has driven capital into traditional safe-haven assets, pushing gold and silver prices to record highs, while Bitcoin continues to search for a bottom. However, network economist Timothy Peterson believes that BTC will eventually catch up with gold’s upward momentum. On X, he likened that gold and Bitcoin are heading toward the same destination, differing only in speed and route.
Although the long-term outlook remains positive, Bitcoin’s short-term picture is less solid. Trader CrypNuevo stated in a series of analyses on X that BTC may still face correction pressures as uncertain factors have not yet eased. Key levels to watch include the 2026 opening price around 87,000 USD and the bottom of the trading range at 80,500 USD.
So, can Bitcoin and the top altcoins rebound from these important support zones? Let’s delve into the chart analysis of the 10 largest cryptocurrencies to find the answer.
Technical Analysis of SPX
The S&P 500 (SPX) is facing selling pressure around the 7,000-point mark, but a positive sign is that the bulls have not surrendered much advantage to the bears.
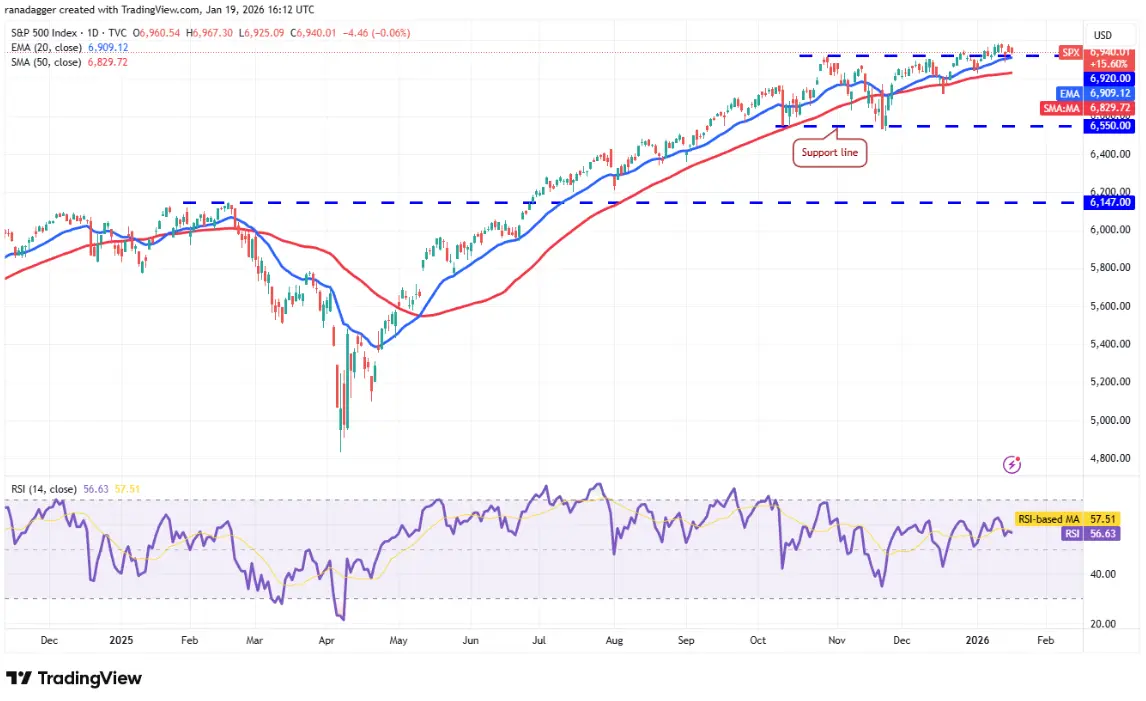 Daily SPX Chart | Source: TradingView The first sign of weakening will appear if the price breaks below the 20-day exponential moving average (EMA) at 6,909 points, indicating profit-taking by the bulls. Buyers are expected to defend the 50-day simple moving average (SMA) at 6,829 points, because if this level is breached, the correction could extend to the 6,720 region.
Conversely, if the price rebounds from the moving averages, the bulls will attempt to resume the upward trend. If it surpasses the resistance at 7,000 points, the index could break out toward the 7,290 region.
Technical Analysis of DXY
The US Dollar Index (DXY) rose above the 50-day SMA (98.99) on Monday, but higher price levels are attracting selling.
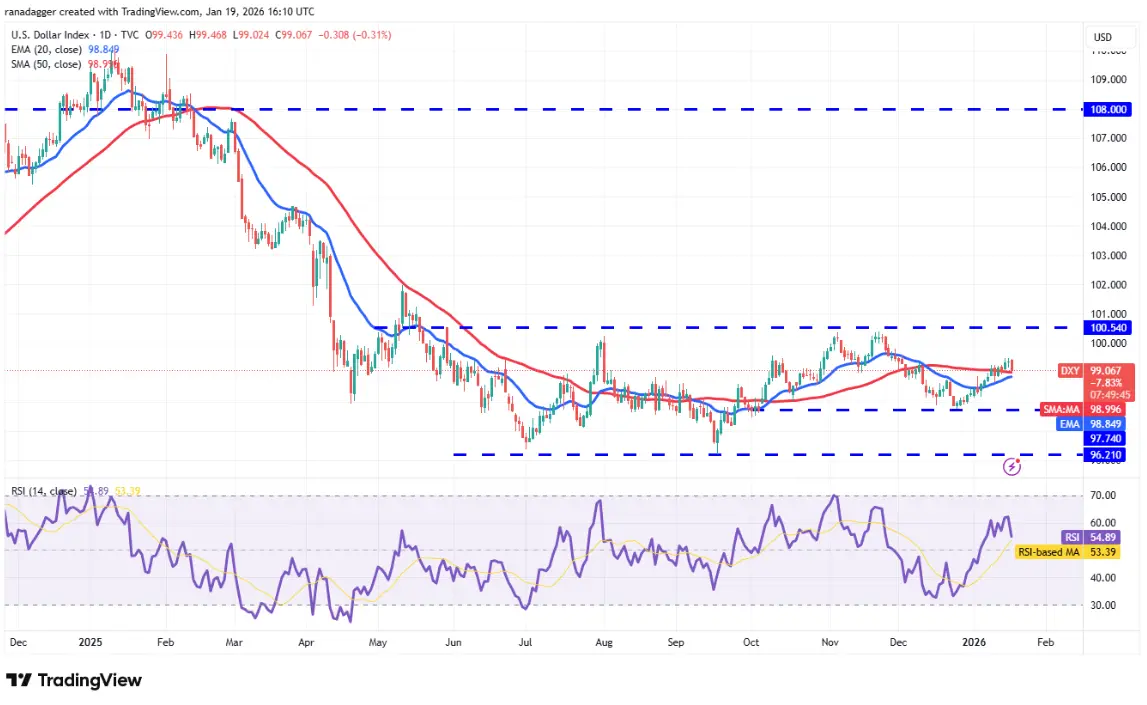 Daily DXY Chart | Source: TradingView If the price falls below the moving averages, the index may continue to fluctuate within the range of 97.74 to 100.54 for some time.
On the other hand, if the price surges strongly from the moving averages, it indicates buying interest during the correction. Then, the bulls will try to push the price above the resistance at 100.54. The bears are expected to defend this level aggressively, as a close above 100.54 could mark the start of a new uptrend.
Technical Analysis of BTC
Bitcoin’s correction has reached the 20-day EMA at 92,625 USD — a key short-term support zone to monitor.
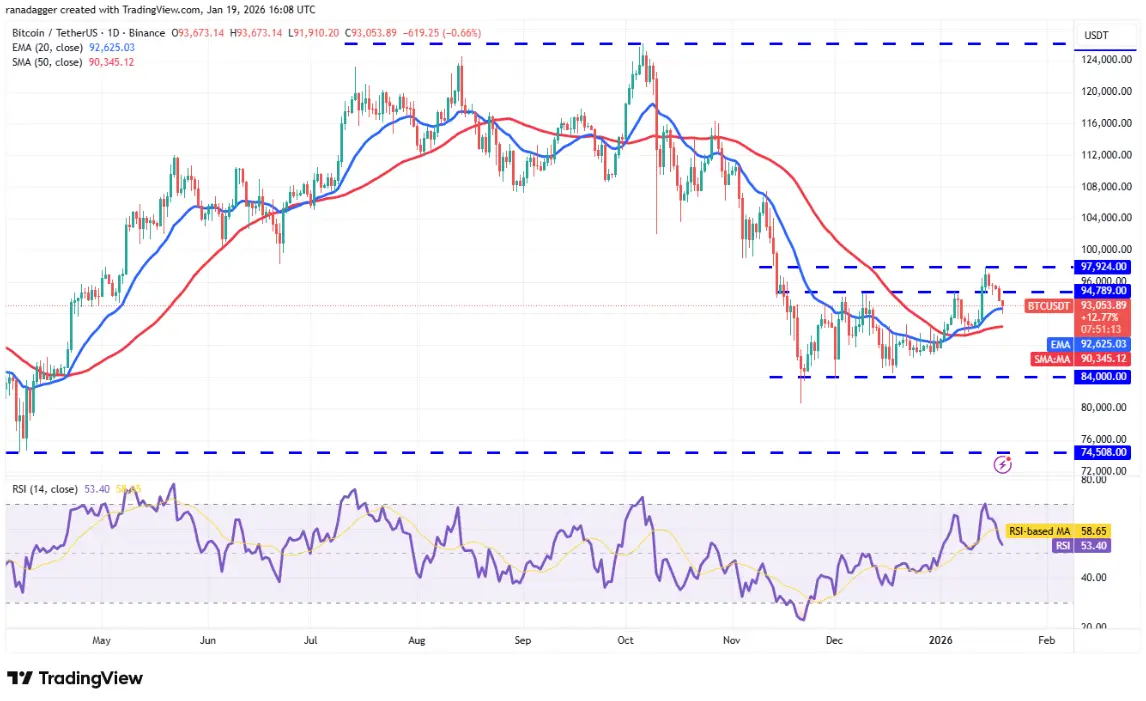 Daily BTC/USDT Chart | Source: TradingView If the price bounces strongly from the 20-day EMA, it reflects positive market sentiment and increases the likelihood of breaking above the 97,924 USD mark. In that case, the BTC/USDT pair could rise to 100,000 USD and further to 107,500 USD.
Conversely, if the price breaks below and closes under the moving averages, it indicates that the bulls are gradually losing control. Then, Bitcoin could trade within the range of 84,000 to 97,924 USD for a few days.
Technical Analysis of ETH
Ether (ETH) is still trapped in an symmetrical triangle pattern, reflecting market hesitation about the next move.
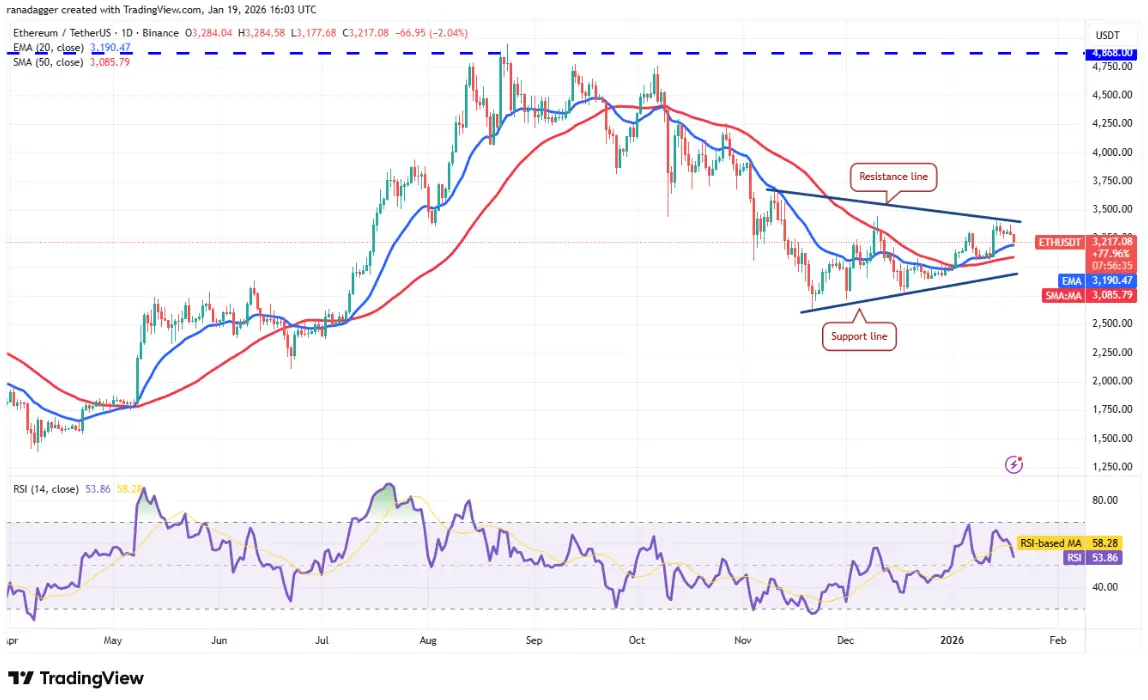 Daily ETH/USDT Chart | Source: TradingView The 20-day EMA (3,190 USD) and the relative strength index (RSI) around the neutral zone suggest that neither side has a clear advantage. If the price closes below the 20-day EMA, ETH/USDT could continue to oscillate within the triangle pattern.
The advantage will tilt toward the bulls if Ether closes above the resistance of the pattern. Then, the pair could move toward the 3,569 USD region and eventually 4,000 USD. On the other hand, if the price closes below the support line, the pair risks falling to 2,623 USD.
Technical Analysis of XRP
Breaking below the 50-day SMA (2 USD) indicates that the bears have returned to the market.
 Daily XRP/USDT Chart | Source: TradingView The bears will try to consolidate their position by pulling the price back to the strong support zone between 1.61 USD and the support line of the price channel. If the price rebounds strongly from this zone, it suggests that XRP/USDT may continue to oscillate within the channel for some more time.
The downward momentum is likely to increase if the price closes below the support line, which could cause the pair to plunge toward the October 10 low of 1.25 USD.
Buyers need to push XRP above the downtrend line to signal a potential trend reversal.
Technical Analysis of BNB
The bears pulled BNB below the 20-day EMA (912 USD) on Monday, but the long wick indicates buying interest at lower levels.
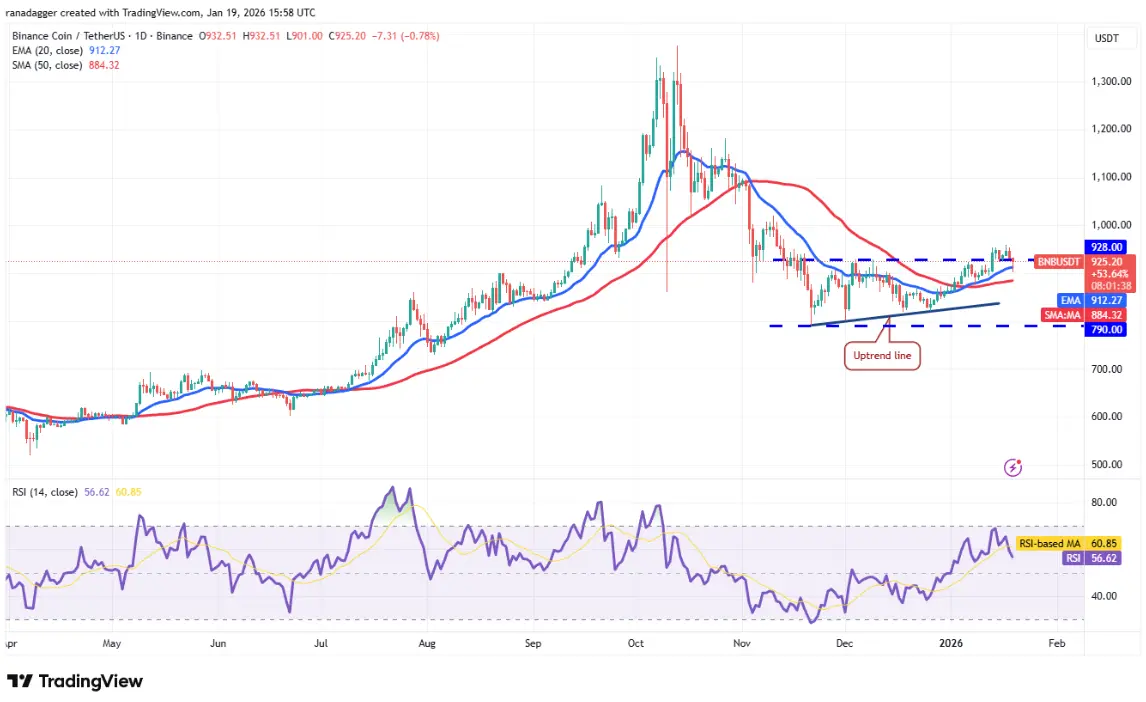 Daily BNB/USDT Chart | Source: TradingView Bulls need to push the price above 960 USD to confirm the start of a new rally, targeting the pattern’s target at 1,066 USD.
However, the bears are unlikely to stay idle. They will try to defend the upper resistance zone and drag BNB/USDT below the 50-day SMA (884 USD). If that happens, it indicates the market has rejected the breakout above 928 USD, and the pair could slide back toward the upward trendline, even down to 790 USD.
Technical Analysis of SOL
Solana (SOL) has turned down from the resistance zone of 147 USD and retreated to the 50-day simple moving average (SMA) around 132 USD, showing strong bearish activity at higher levels.
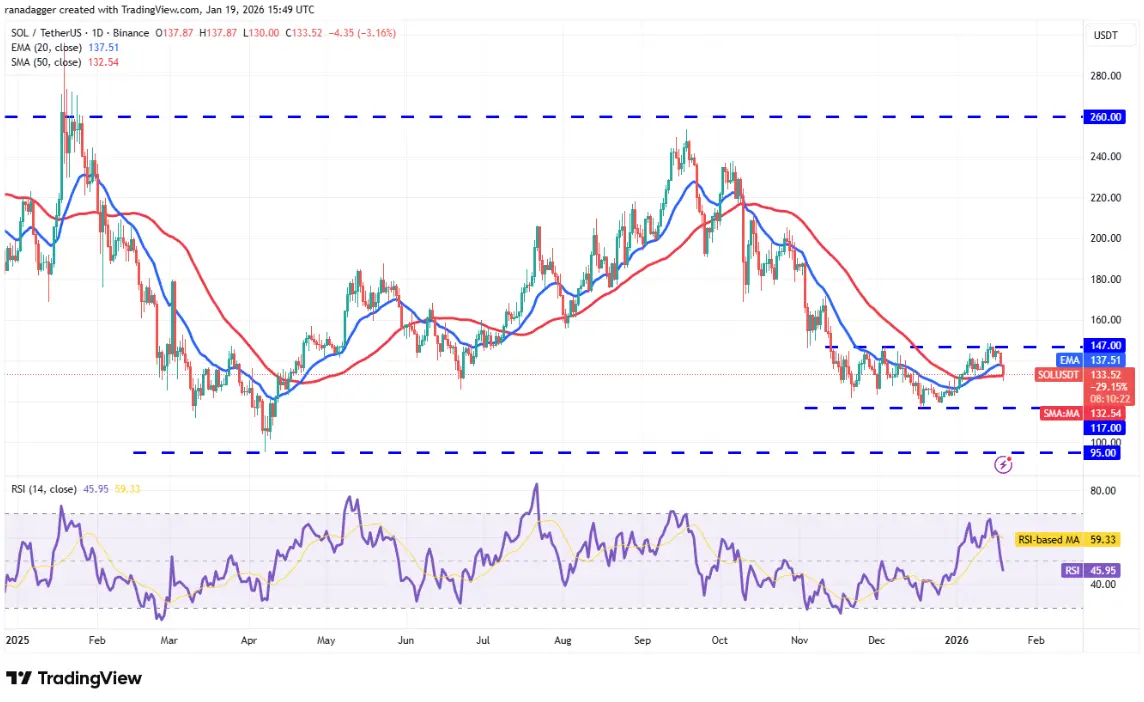 Daily SOL/USDT Chart | Source: TradingView Both moving averages are flat, while RSI remains just below the neutral mark, suggesting SOL/USDT may continue to move sideways within the 117–147 USD range for some time.
To signal the start of a new rally, bulls need to push Solana above 147 USD; then, the price could target 172 USD. Conversely, if it breaks below 117 USD, the pair could fall sharply toward 95 USD.
Technical Analysis of DOGE
Dogecoin (DOGE) fell below the moving averages on Sunday and touched the support zone at 0.12 USD on Monday.
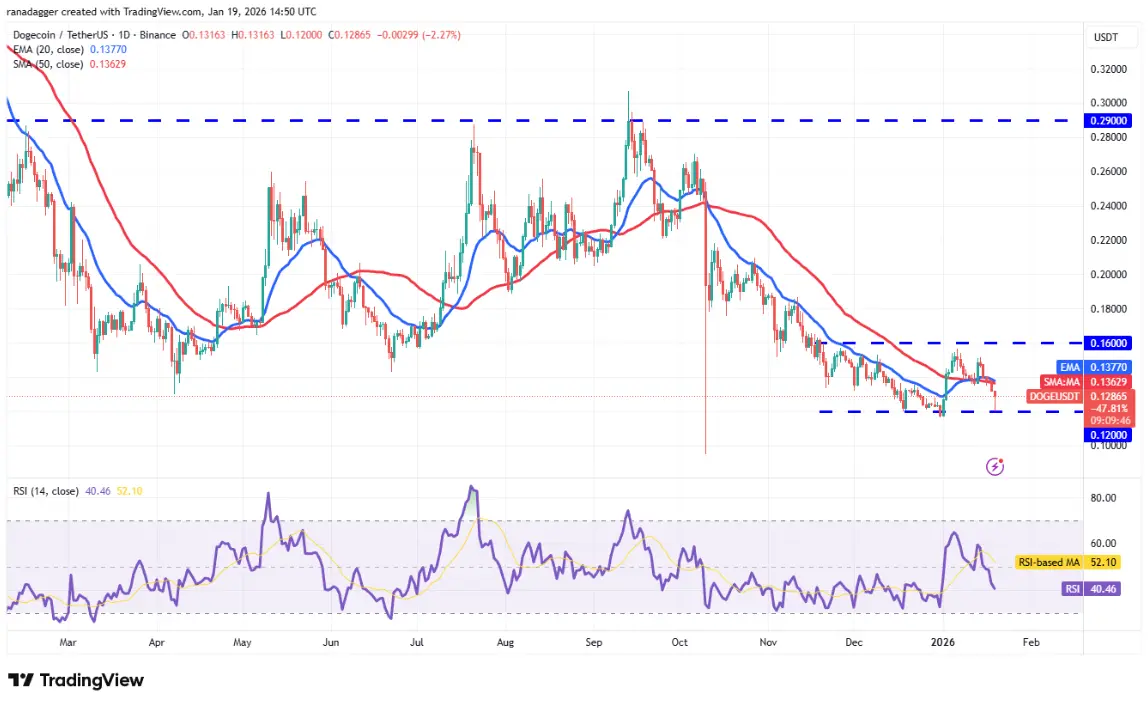 Daily DOGE/USDT Chart | Source: TradingView The long wick indicates that the bulls are defending the 0.12 USD zone. Despite resistance at the moving averages, if the bulls manage to break above them, DOGE/USDT could continue to oscillate within the 0.12–0.16 USD range for a few more days.
Otherwise, if Dogecoin’s price continues to weaken or gets rejected at the moving averages and breaks below 0.12 USD, it will signal a bearish trend reversal. Then, the pair could retest the October 10 low around 0.10 USD.
Technical Analysis of ADA
Cardano (ADA) broke below the moving averages on Sunday and is heading toward the support zone at 0.33 USD.
 Daily ADA/USDT Chart | Source: TradingView If the price rebounds strongly from 0.33 USD, bulls will attempt to push ADA/USDT above the downtrend line. Success would see Cardano’s price move toward the breakout zone around 0.50 USD.
Otherwise, if it breaks below 0.33 USD, the next target is likely the support line of the descending channel pattern. Bulls are expected to defend this support, which is near the October 10 low at around 0.27 USD.
Technical Analysis of BCH
Bitcoin Cash (BCH) closed below the 50-day SMA (594 USD) on Saturday, indicating sellers are trying to take control.
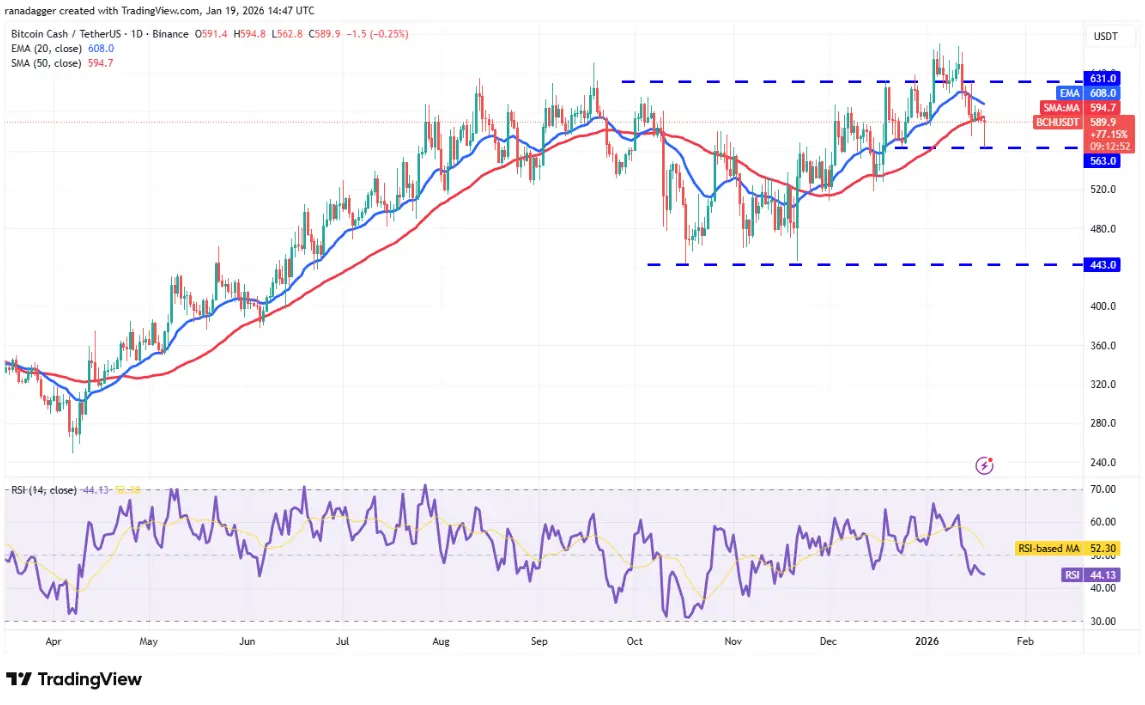 Daily BCH/USDT Chart | Source: TradingView The 20-day EMA (608 USD) has started to turn downward, and RSI is in the negative zone, reflecting a bearish advantage. A rebound from 563 USD is likely to face selling pressure at the 20-day EMA. If BCH’s price drops sharply from the 20-day EMA, the support at 563 USD could be broken, and the pair might plunge toward 518 USD.
The first sign of strength will be a move above the 20-day EMA; then, the pair could rise toward 631 USD, where bears are expected to re-enter.