
Key Takeaways
-
Fartcoin (FARTCOIN) is trading near $0.33 amid a broader crypto market sell-off driven by macro uncertainty.
-
The 4H chart shows a Bullish Bat harmonic pattern, often associated with short-term trend reversals.
-
Price has reacted positively from the D-point support near $0.288, hinting at seller exhaustion.
-
A breakout above the 50-period moving average around $0.374 could confirm bullish momentum.
-
Harmonic targets point toward $0.404 and $0.476 if the pattern plays out successfully.
-
A breakdown below $0.288 would invalidate the bullish setup.
As of January 19, 2026, Fartcoin (FARTCOIN) is trading slightly lower around $0.33, moving in line with the broader crypto market pullback. The sell-off was triggered by escalating US–EU trade tensions, which sparked nearly $875 million in long liquidations and pushed major assets like Bitcoin (BTC) and Ethereum (ETH) down more than 2% over the past 24 hours.
While FARTCOIN is down over 3% at the time of writing, the price action beneath the surface tells a more interesting story. The latest chart structure is now flashing a potential bullish harmonic setup, suggesting the current dip could be more of a setup than a breakdown.
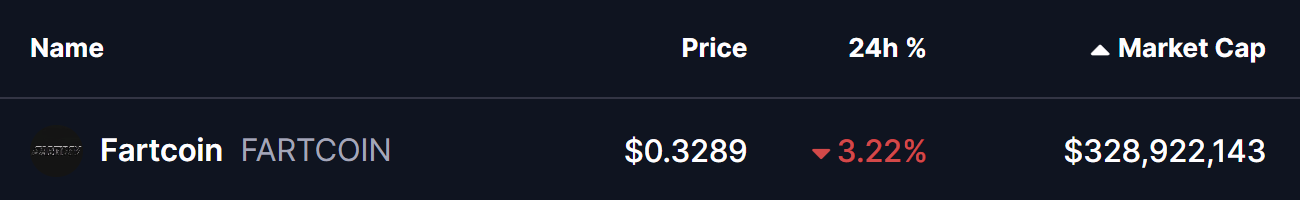
Source: Coinmarketcap
Harmonic Pattern Signals a Possible Reversal
On the 4-hour timeframe, Fartcoin is forming a well-defined Bullish Bat harmonic pattern, a structure often associated with short-term reversals after corrective phases.
The pattern began with the X point near $0.258, followed by a strong impulsive rally toward point A. Price then retraced to point B, rebounded to point C, and finally completed the structure at point D near $0.288. This D zone typically acts as the potential reversal area for the Bat pattern.
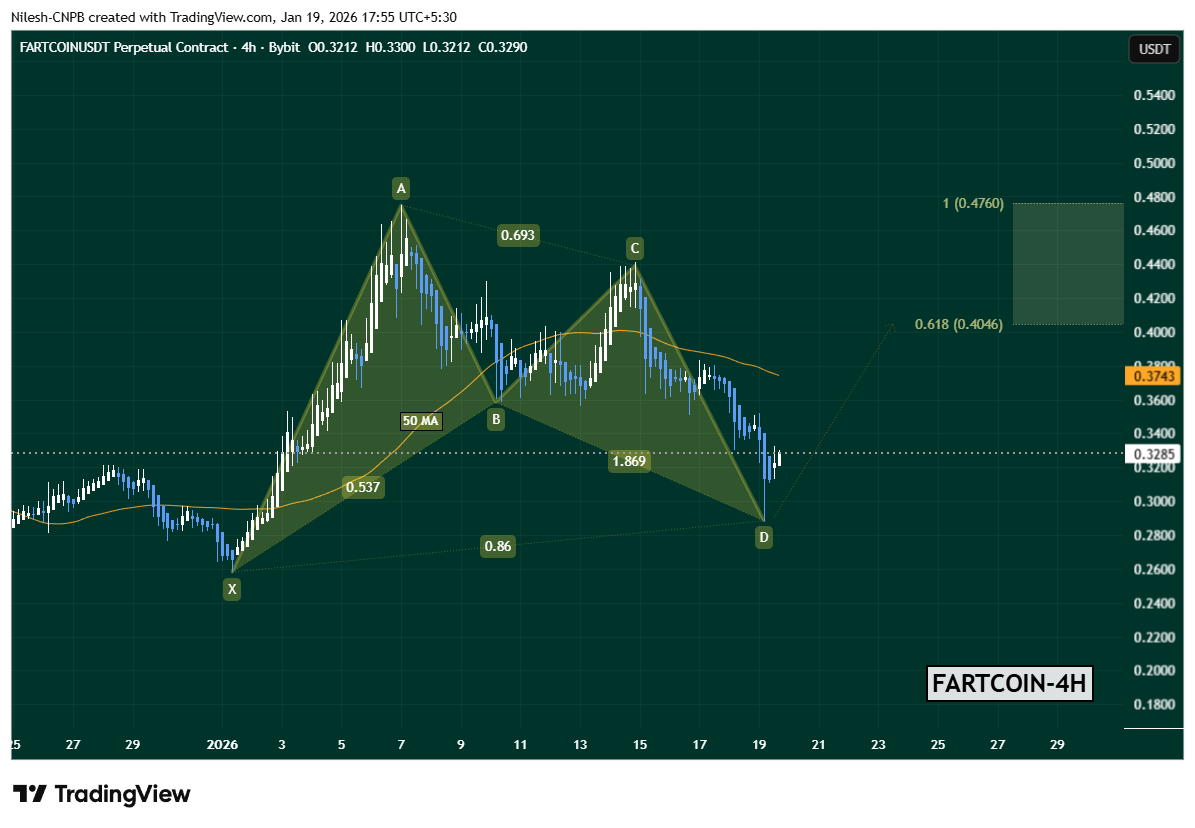
FARTCOIN Daily Chart/Coinsprobe (Source: Tradingview)
Following the completion of point D, FARTCOIN has already shown early signs of stabilization, bouncing back toward $0.3285. This initial reaction suggests that sellers may be losing momentum at current levels.
Key Levels That Could Decide the Move
One key level now in focus is the 50-period moving average, currently hovering around $0.3743. This level has acted as dynamic resistance in recent sessions and will likely determine whether the rebound gains traction or fades.
If buyers manage to push FARTCOIN above the 50 MA with improving volume, the harmonic projection opens the door for upside targets around:
This zone historically represents the area where Bat-pattern-driven moves tend to pause or face profit-taking.
On the flip side, the bullish setup remains valid only as long as price holds above the D-point support near $0.288. A decisive breakdown below this level would invalidate the harmonic structure and could expose FARTCOIN to deeper downside before any meaningful recovery attempt.
Bottom Line
Despite the ongoing market-wide weakness, Fartcoin’s chart is showing early signs of a technical rebound setup. The completion of a Bullish Bat harmonic pattern, combined with a developing bounce from key support, puts FARTCOIN at an important inflection point.
A breakout above the 50 MA could shift short-term momentum back in favor of the bulls, while failure to hold the D-point support would keep bears in control. For now, traders will be watching closely to see whether this harmonic signal translates into a sustained recovery or turns out to be another false start in a volatile market.
Disclaimer: The views and analysis presented in this article are for informational purposes only and reflect the author’s perspective, not financial advice. Technical patterns and indicators discussed are subject to market volatility and may or may not yield the anticipated results. Investors are advised to exercise caution, conduct independent research, and make decisions aligned with their individual risk tolerance.
About Author: Nilesh Hembade is the Founder and Lead Author of Coinsprobe, with over 5 years of experience in the cryptocurrency and blockchain industry. Since launching Coinsprobe in 2023, he has been providing daily, research-driven insights through in-depth market analysis, on-chain data, and technical research.
Disclaimer: The information on this page may come from third parties and does not represent the views or opinions of Gate. The content displayed on this page is for reference only and does not constitute any financial, investment, or legal advice. Gate does not guarantee the accuracy or completeness of the information and shall not be liable for any losses arising from the use of this information. Virtual asset investments carry high risks and are subject to significant price volatility. You may lose all of your invested principal. Please fully understand the relevant risks and make prudent decisions based on your own financial situation and risk tolerance. For details, please refer to
Disclaimer.
Related Articles
Circle stock price surges 87% in a month! How the US-Iran war and trader position adjustments are driving the rally?
Circle's stock price surged 87% in a single month due to the impact of the US-Iran conflict. Analysts have pointed out that its stock is overvalued, and the discounted cash flow model shows an intrinsic value of $42.25. The current stock price of $111.84 is 164.7% higher. The price-to-sales ratio also emphasizes that the stock is overvalued, indicating a high risk of overestimation.
CryptoCity7m ago
"1011 Insider Whale" Agent: Brent Crude Oil remains in the first phase, and whether the Strait of Hormuz is open or not is a key variable
Gate News reports that agent Garrett stated that Brent crude oil remains in the first stage, and market dynamics have not substantively changed. The key issue is whether the Strait of Hormuz will remain open; continued restrictions will impact the energy market.
GateNews7m ago
Bitcoin bottom signals reappear? Analysts say "simple mathematical model" may indicate key support for a new cycle
Recently, crypto analyst Chetan Gurjar reviewed the analytical framework that successfully identified the 2022 bear market bottom, emphasizing Bitcoin's response within the long-term structure. He believes that if it breaks through the current resistance zone, it could form a new cycle bottom and influence future trends.
GateNews9m ago
Why does Bitcoin remain steady at $70,000 despite soaring oil prices and the clouds of war? Institutional and whale funds are the key support
As the Iran situation escalates and oil prices rise, global stock markets come under pressure, but Bitcoin defies the trend with an approximately 4% increase, reaching $70,000. Large institutions continue to buy through OTC trading, with over $700 million in funds flowing into Bitcoin-related ETFs, supporting market sentiment. Major holders slightly increase their holdings, indicating institutional and corporate optimism about Bitcoin, becoming an important force in its price stability.
GateNews18m ago
Solana ETF defies the trend and attracts funds: SOL has fallen over 30% this year, but institutional funds continue to invest
Although Solana's price has fallen more than 31% this year, its spot ETF still attracted a large influx of funds, totaling approximately $1.5 billion, indicating strong interest from institutional investors. Despite recent outflows, the overall amount remains close to $960 million, and the market has widely discussed this phenomenon, believing that the main driving force is long-term investment confidence.
GateNews19m ago