
Key Takeaways
-
Algorand (ALGO) is consolidating after a 13% decline over the past 60 days, while showing stabilization in the last month.
-
The daily chart reveals a repeating bullish fractal, similar to the setup that triggered ALGO’s 300% rally in November 2024.
-
Price is holding inside a long-term accumulation zone between $0.11 and $0.1530.
-
The 200-day moving average near $0.1912 is acting as key resistance and breakout confirmation level.
-
A successful reclaim of the 200 MA could open the path toward $0.60 and the ascending resistance trendline, while a drop below $0.11 would invalidate the bullish setup.
ALGO, the native token of Algorand’s Layer-1 blockchain, has shown steady but muted momentum over the past 30 days, helping slow down its broader correction. Despite this stabilization, ALGO remains down more than 13% over the last 60 days, keeping sentiment cautious across the market.
That said, when looking beyond short-term price noise, the daily chart is beginning to tell a familiar story. The current structure closely resembles a bullish fractal that, in the past, preceded a powerful breakout rally—raising an important question for traders: is this just consolidation, or a quiet accumulation phase before the next move?
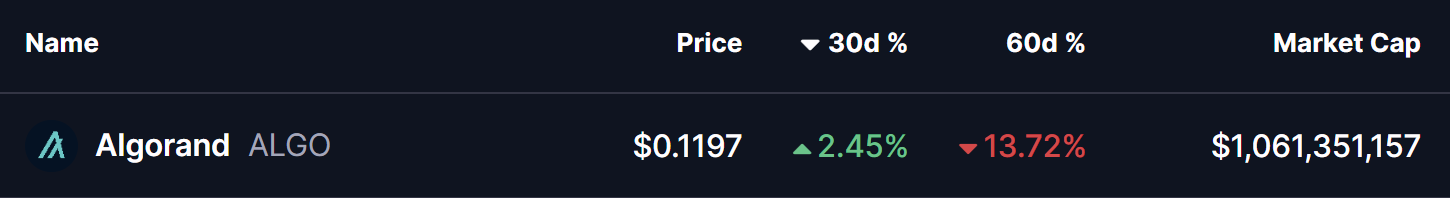
Source: Coinmarketcap
Fractal Setup Hints at a Bullish Reversal
On the daily timeframe, ALGO is displaying early signs of a repeating bullish structure, built around three key technical elements:
-
A rejection from the long-term ascending resistance trendline
-
A prolonged accumulation zone at major historical support
-
A potential reclaim of the 200-day moving average
The current corrective phase began in December 2024, when ALGO was rejected near the ascending resistance trendline around $0.60. That rejection triggered a deep pullback of more than 80%, eventually driving price back into the long-term demand zone between $0.11 and $0.1530—a region that has repeatedly acted as an accumulation area on the chart.
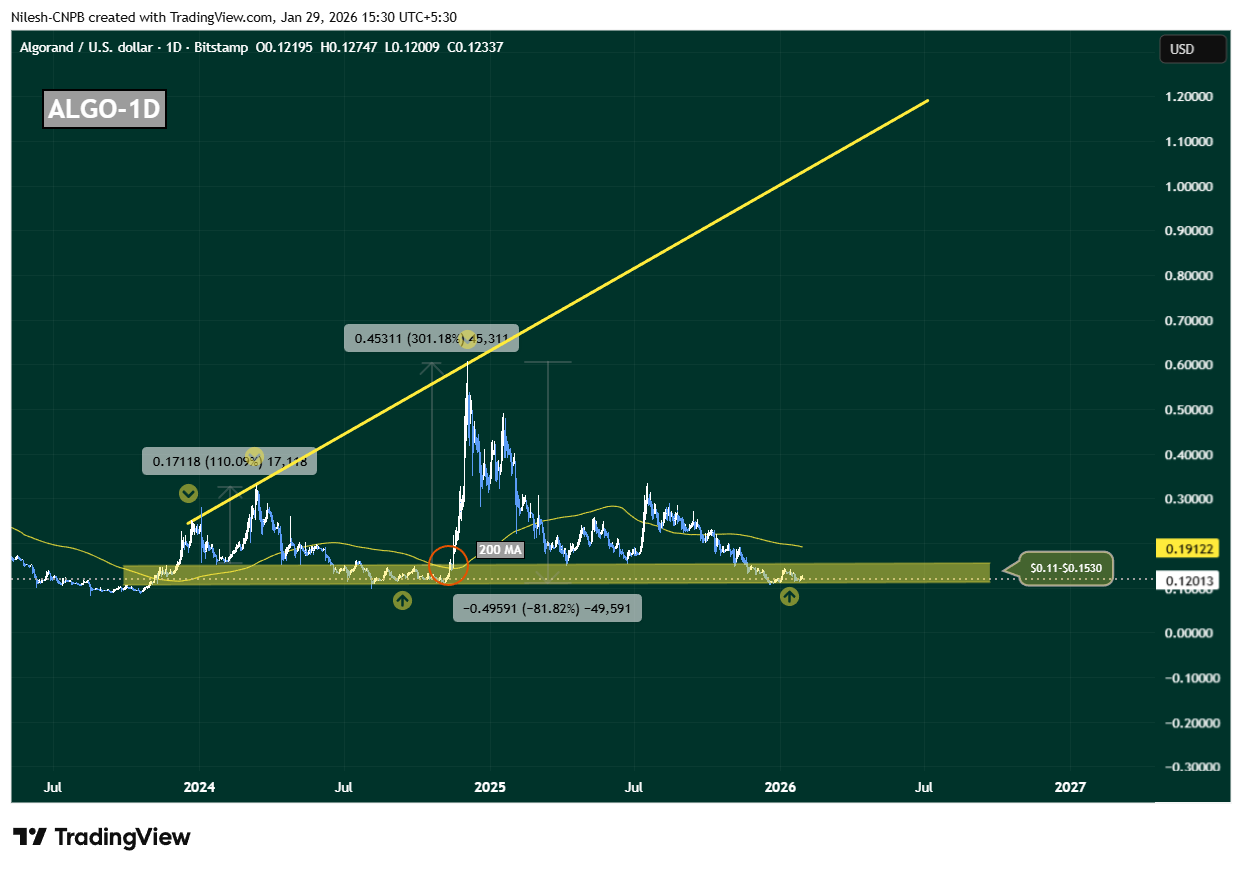
Algorand (ALGO) Daily Chart/Coinsprobe (Source: Tradingview)
This zone is not just technically important; it has also served as a launchpad during previous cycles, where downside momentum stalled and long-term buyers quietly stepped in.
History Rhymes on the ALGO Chart
What makes this setup particularly compelling is how closely it mirrors November 2024’s breakout structure. Back then, ALGO spent extended time consolidating near the same support band before reclaiming the 200-day moving average. Once that level flipped into support, price accelerated sharply—resulting in a 300% rally toward the ascending resistance trendline.
Today, ALGO is once again compressing inside this accumulation range, while the 200-day moving average sits overhead near $0.1912, acting as dynamic resistance. This alignment suggests the market may be approaching another inflection point.
What’s Next for ALGO?
At present, ALGO is hovering near $0.12, firmly inside its long-term accumulation zone. As long as price holds above this region, the broader bullish fractal remains intact.
A clean and sustained reclaim of the 200-day moving average around $0.1912 would be a critical confirmation signal. If bulls manage to flip this level into support, it would closely replicate previous breakout conditions and could trigger a sharp upside expansion. In that scenario, $0.60 becomes a realistic medium-term target, with further upside possible toward the ascending resistance trendline if momentum builds.
However, the structure is not without risk. A decisive breakdown below $0.11 would weaken the accumulation thesis, signal loss of long-term support, and open the door for deeper downside.
For now, ALGO sits at a make-or-break zone. The chart suggests patience is key—but if history repeats, this quiet phase may not last much longer.
Disclaimer: The views and analysis presented in this article are for informational purposes only and reflect the author’s perspective, not financial advice. Technical patterns and indicators discussed are subject to market volatility and may or may not yield the anticipated results. Investors are advised to exercise caution, conduct independent research, and make decisions aligned with their individual risk tolerance.
About Author: Nilesh Hembade is the Founder and Lead Author of Coinsprobe, with over 5 years of experience in the cryptocurrency and blockchain industry. Since launching Coinsprobe in 2023, he has been providing daily, research-driven insights through in-depth market analysis, on-chain data, and technical research.
Disclaimer: The information on this page may come from third parties and does not represent the views or opinions of Gate. The content displayed on this page is for reference only and does not constitute any financial, investment, or legal advice. Gate does not guarantee the accuracy or completeness of the information and shall not be liable for any losses arising from the use of this information. Virtual asset investments carry high risks and are subject to significant price volatility. You may lose all of your invested principal. Please fully understand the relevant risks and make prudent decisions based on your own financial situation and risk tolerance. For details, please refer to
Disclaimer.
Related Articles
BTC 15-minute increase of 0.70%: On-chain capital inflow and market sentiment resonate to drive price movement
From March 10, 2026, 08:00 to 08:15 (UTC), BTC achieved a +0.70% return within 15 minutes, with a price range of 70375.2 to 70926.3 USDT and an amplitude of 0.78%. This short-term fluctuation is significantly higher than the volatility of mainstream coins during the same period, attracting market attention. The increased volatility has prompted investors to closely monitor the market.
The main driver of this fluctuation is large on-chain capital inflows into mainstream trading platforms, with a surge in short-term buying activity. Additionally, some institutional or whale accounts concentrated their positions during the window period, significantly driving the price upward. Meanwhile, market exchanges BTC
GateNews9m ago
JELLYJELLY Contract and Spot Price Discrepancy at 34%, Manipulation Warning Alert Triggered
JELLYJELLY tokens experienced an extreme divergence of 34% between the perpetual contract mark price and the on-chain spot price on March 10, suspected of price manipulation. Analysis shows a surge in open interest and a funding rate reaching -2% every 4 hours, indicating market instability and manipulation risk. Analysts warn investors that this situation could trigger significant price volatility and reflects structural risks during the integration process of decentralized and centralized exchanges.
MarketWhisper23m ago
SHIB Price Drops Despite 53,000% Burn Increase — Understanding the Disconnect
Burn Impact: 172 million SHIB burned reduces supply by 0.00003 percent, too small to move price.
Market Pressure: Bitcoin retreat drags SHIB lower despite burn spike and headlines.
Technical Signals: Price tests $0.00000545 support; break below $0.00000530 could trigger further
CryptoNewsLand45m ago
CPI Data Preview: Bitcoin Approaching $70,000 Key Resistance, Crypto Market May Experience Volatile Fluctuations
As the US CPI data is about to be released, the cryptocurrency market is entering a wait-and-see mode. Bitcoin, after experiencing a correction, is approaching $70,000, and market sentiment has improved, but it faces a short-term key resistance level. CPI data will be the main factor driving short-term market volatility.
GateNews45m ago
Is Bitcoin About to Break Through? Peter Brandt's "Banana Split" Pattern Indicates a Potential Significant Rise in BTC
Senior trader Peter Brant pointed out that Bitcoin is forming a "banana split" chart pattern, indicating potential significant volatility and a breakout from historical price ranges. The recent appearance of the "little banana" may be building momentum for a bull market. He predicts that Bitcoin will experience a price surge by October 2026. Global market sentiment is warming, fueling a 3.2% intraday increase in Bitcoin, currently trading at $69,803. Investors should pay attention to key price ranges to assess market trends.
GateNews58m ago