
Key Takeaways
-
Ethereum ($ETH) has broken below the critical $2,637 support, signaling a shift in short-term market structure.
-
Price is now trading near $2,400, posting an 11.10% daily loss and a 18% year-to-date decline.
-
The current price action mirrors a bearish fractal from August 2024, raising the risk of further downside.
-
If selling pressure persists, ETH could slide toward the $2,128 support zone, where buyers may attempt a defense.
Ethereum ($ETH), the second-largest cryptocurrency by market capitalization, is once again under heavy selling pressure. As of January 31, 2026, ETH has slipped near the $2,400 mark, printing an 11.10% decline in the last 24 hours and extending its year-to-date losses to 18.73%, while also marking a fresh yearly low.
The sharp move lower has shifted short-term sentiment firmly in favor of the bears, with both price structure and derivatives data flashing warning signs.
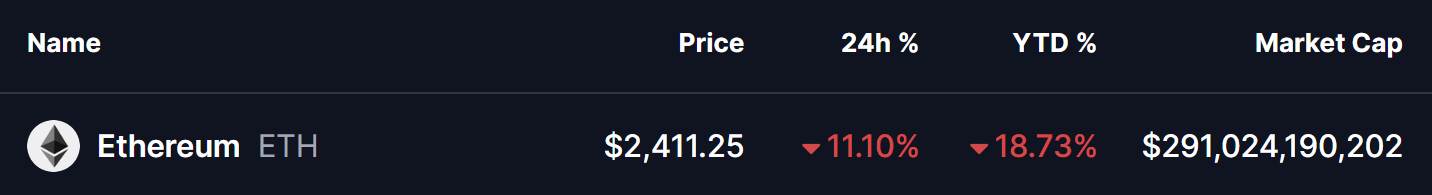
Source: Coinmarketcap
Liquidations Soar as Bulls Get Trapped
The downside move has been amplified by aggressive liquidations across the derivatives market. Recent data shows over $553 million worth of ETH positions liquidated, with a striking $523 million coming from long positions, compared to just $30 million in shorts over the past 24 hours.
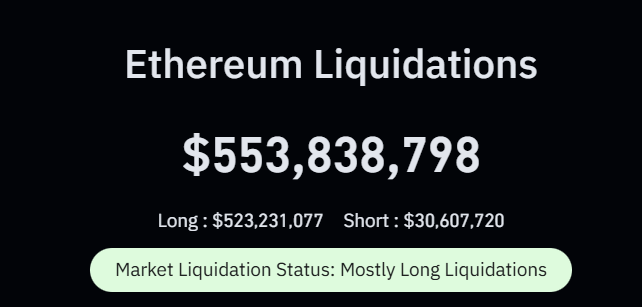
Ethereum (ETH) Liquidations/Source: Coinglass
This imbalance highlights a classic scenario of over-leveraged bulls getting flushed out, where forced sell orders accelerate downside momentum. When liquidations skew this heavily toward longs, price often struggles to find immediate relief, as dip buyers hesitate and momentum traders press their advantage.
Bears Take Control on the Daily Chart
From a technical perspective, Ethereum’s daily chart paints a concerning picture. ETH has decisively lost the $2,637 horizontal support, a level that previously acted as a floor during consolidation. Once this zone gave way, selling pressure intensified, dragging price swiftly toward the $2,400 region.
What makes this move particularly notable is its resemblance to a previous downside fractal visible on the chart. Back in August 2024, ETH broke a similar support structure, triggering a sharp continuation move that ultimately drove price into a deeper corrective phase before buyers finally stepped in.
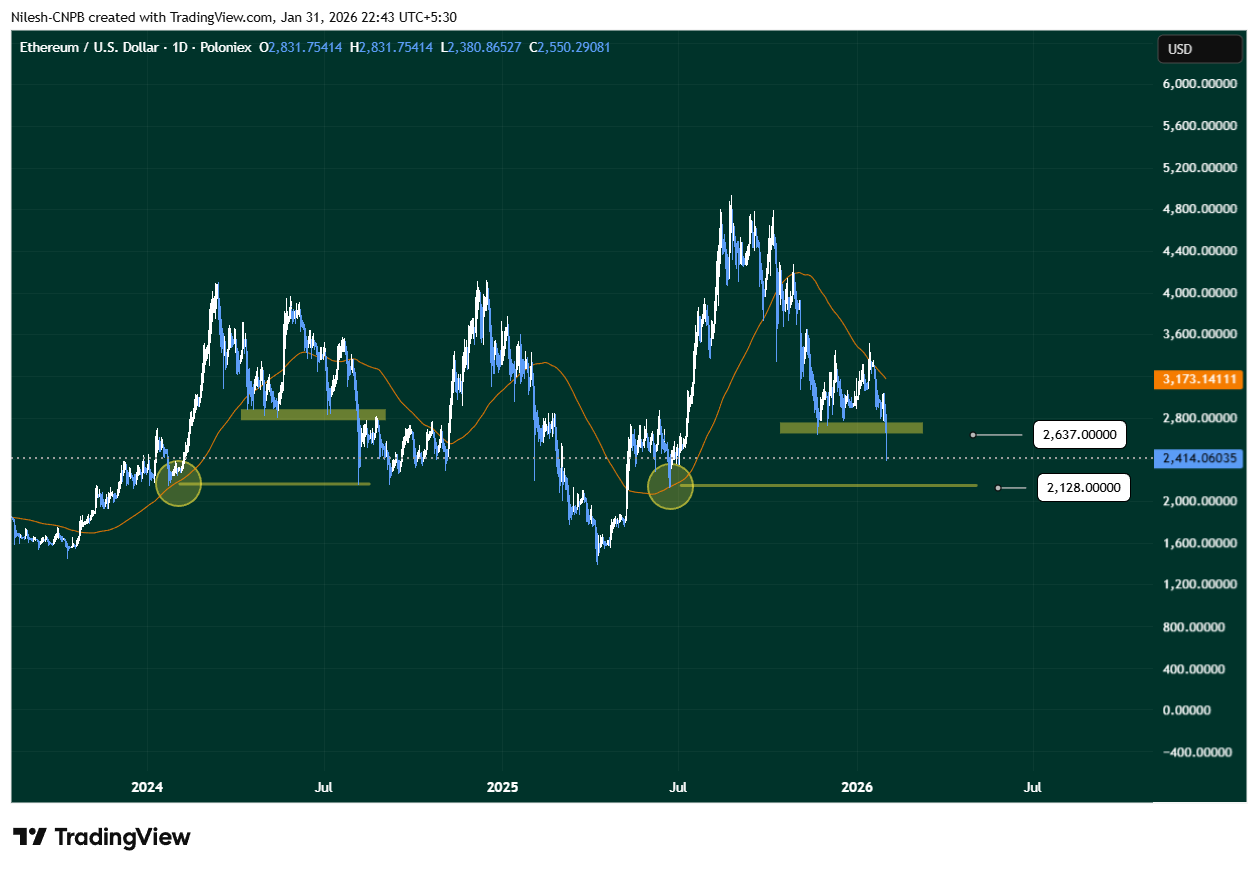
Ethereum (ETH) Daily Chart/Coinsprobe (Source: Tradingview)
The current structure appears to be echoing that same behavior—support break, rapid downside expansion, and limited bounce attempts so far.
More Pain Ahead?
If this historical fractal continues to play out, Ethereum could be heading toward its next major support near $2,128, a zone that previously attracted strong demand. This level stands out as a potential area where longer-term buyers may begin to show interest, especially if broader market conditions stabilize.
On a flip side, a strong reclaim of the $2,637 resistance zone, followed by acceptance above it, would invalidate the current fractal setup and suggest that today’s breakdown was a false move. Such a recovery would likely force late shorts to cover and could stabilize price action.
For now, however, Ethereum remains vulnerable. With heavy long liquidations, broken support, and a familiar bearish pattern resurfacing on the chart, the path of least resistance appears tilted to the downside—at least in the short term.
Disclaimer: The views and analysis presented in this article are for informational purposes only and reflect the author’s perspective, not financial advice. Technical patterns and indicators discussed are subject to market volatility and may or may not yield the anticipated results. Investors are advised to exercise caution, conduct independent research, and make decisions aligned with their individual risk tolerance.
About Author: Nilesh Hembade is the Founder and Lead Author of Coinsprobe, with over 5 years of experience in the cryptocurrency and blockchain industry. Since launching Coinsprobe in 2023, he has been providing daily, research-driven insights through in-depth market analysis, on-chain data, and technical research.
Disclaimer: The information on this page may come from third parties and does not represent the views or opinions of Gate. The content displayed on this page is for reference only and does not constitute any financial, investment, or legal advice. Gate does not guarantee the accuracy or completeness of the information and shall not be liable for any losses arising from the use of this information. Virtual asset investments carry high risks and are subject to significant price volatility. You may lose all of your invested principal. Please fully understand the relevant risks and make prudent decisions based on your own financial situation and risk tolerance. For details, please refer to
Disclaimer.
Related Articles
Bitcoin and Ethereum ETFs Record Daily Outflows While Maintaining Weekly Gains
Gate News bot message, according to the March 6 update, Bitcoin ETFs recorded a daily net outflow of 1,697 BTC (valued at $116.94 million), while maintaining a 7-day net inflow of 13,014 BTC (valued at $896.69 million). Ethereum ETFs showed a daily net outflow of 3,185 ETH (valued at $6.34 million),
GateNews2h ago
"Brother Maqi" deposits $210,000 into HyperLiquid to increase ETH long position by more than 25 times
Gate News Report, March 6, according to Onchain Lens monitoring, "Big Brother MaJie" deposited $210,000 USDC into HyperLiquid to increase his ETH 25x long position. Previously, as the market declined, "Big Brother MaJie" had closed most of his positions at a loss, and his unrealized loss has now exceeded $29.7 million.
GateNews2h ago
ETH drops below 2000 USDT, 24H decline of 5.68%
Gate News Report, March 6th, according to data from a certain CEX market, ETH dropped below 2000 USDT, currently at 1999.87 USDT, down 5.68% in the past 24 hours.
GateNews4h ago
Short-selling firm Culper releases bearish report on Ethereum: Fusaka upgrade disrupts ETH token economics
Aggressive short-selling firm Culper Research has released a report bearish on Ethereum (ETH), believing that the Fusaka upgrade in 2025 will cause structural damage to ETH's token economy. The report points out that a significant decrease in Gas fees has led to increased address pollution attacks and reduced validator rewards, and emphasizes that Ethereum is facing competitive pressure from Solana and L2 solutions. Culper believes that ETH's value capture ability is declining and has started shorting ETH.
ChainNewsAbmedia4h ago
ETH drops below 2000 USDT
Gate News bot message, Gate market display, ETH drops below 2000 USDT, current price 1998.74 USDT.
CryptoRadar4h ago
ETH 15-minute sharp decline of 1.53%: Large investors' short-term profit-taking and ETF capital outflows resonate, triggering a significant drop
From 13:45 to 14:00 on March 6, 2026 (UTC), ETH experienced a significant fluctuation, with a short-term decline of 1.53%. The price fluctuated sharply between 2019.21 and 2051.26 USDT, with an amplitude of 1.56%. High-frequency sell orders surged, market attention spiked, trading volume increased, and the divergence between bulls and bears intensified. Market sentiment became more cautious.
The main driving force behind this fluctuation was large investors and whale accounts reducing their positions after a short-term rebound, leading to a rapid release of large sell orders and triggering short-term selling pressure in the market. On the ETF front, holdings
GateNews4h ago