In the cryptocurrency market, “bottom fishing” is an extremely tempting yet highly risky game. If you are also passionate about identifying market turning points, this on-chain indicator that has been validated through multiple bull and bear cycles may become your “North Star” for accurately pinpointing bottoms in a bear market.
This indicator is called “Bitcoin Profit and Loss Supply,” primarily used to measure the overall profit and loss status of coin holders in the market — how many bitcoins are still in profit on paper, and how many are trapped in unrealized losses.
Historical data repeatedly shows that when the “profit supply of Bitcoin” and the “loss supply of Bitcoin” approach balance, or even intersect on the chart, it often signals that the bear market bottom has formed, indicating that the market has entered the final stage of “capitulation selling,” and the long-term golden window for accumulation is opening.
For bullish investors hoping for a market rebound, good news may be just around the corner. Data shows that the number of profit chips and loss chips is trending toward a near “crossover.”
According to Glassnode statistics, approximately 11 million bitcoins are currently in profit, meaning their holding costs are below the current market price; meanwhile, about 8.9 million bitcoins are in loss. The gap between the two is narrowing, and if this convergence trend continues, it could replay the bottoming scripts of 2022 and 2018-19.
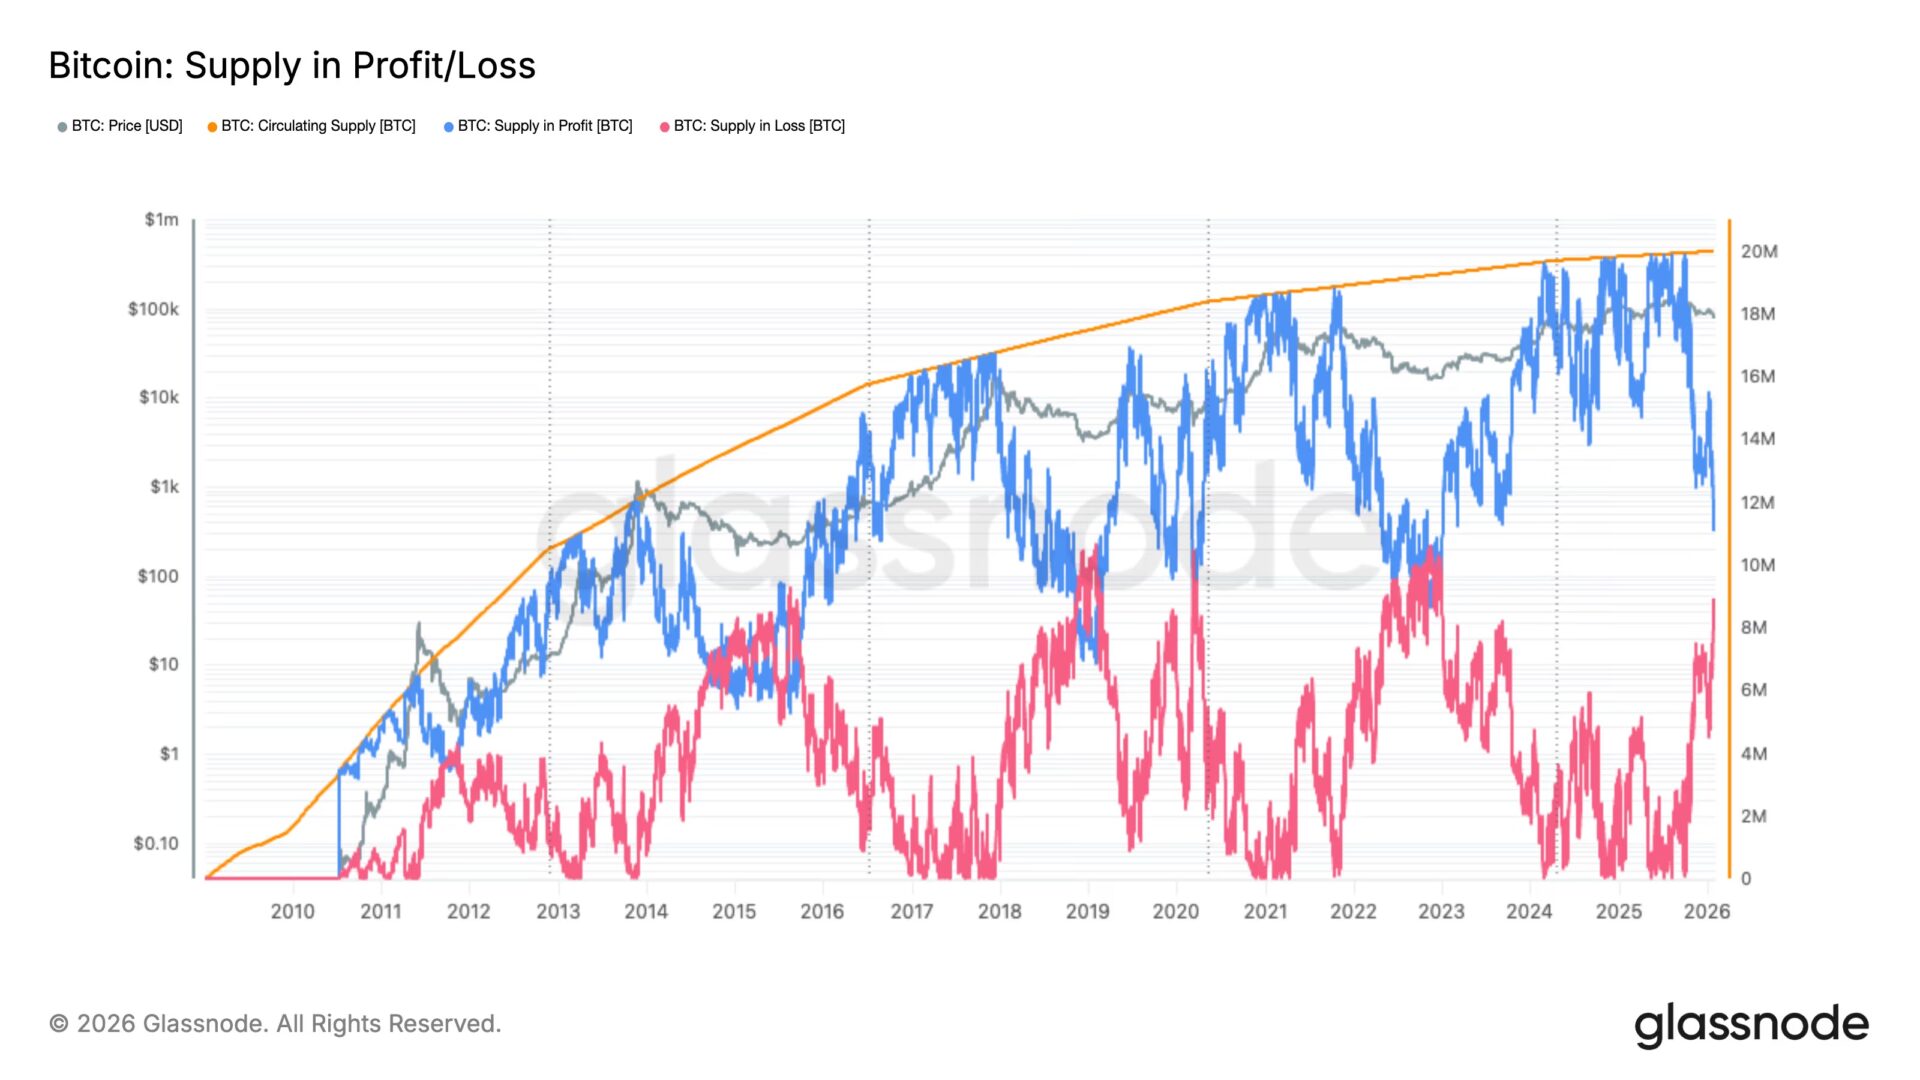
In Glassnode’s analysis chart, the blue line represents “Profit Supply,” and the red line represents “Loss Supply.”
When Bitcoin’s spot price fluctuates around the overall cost basis of investors’ holdings, chips will flow between these two camps. By observing the growth and decline of these two lines, we can gain deep insights into the market’s holding structure and the stress test faced by investors.
Looking back at past cycles, the “crossover points” of these two lines have often precisely marked the bear market bottoms:
- November 2022: During the panic of the FTX exchange collapse, Bitcoin dropped to around $15,000, and the indicator showed a crossover, followed by a market bottom and rebound.
- March 2020: The COVID-19 pandemic triggered a global liquidity crisis, causing Bitcoin to briefly fall below $3,000, with the indicator also issuing a strong signal.
- January 2019: During a prolonged bear winter, Bitcoin fell to around $3,300, and the indicator once again confirmed the bottom.
- 2015: In early market cycles, Bitcoin also exhibited the same structure when trading above $200.
Disclaimer: The information on this page may come from third parties and does not represent the views or opinions of Gate. The content displayed on this page is for reference only and does not constitute any financial, investment, or legal advice. Gate does not guarantee the accuracy or completeness of the information and shall not be liable for any losses arising from the use of this information. Virtual asset investments carry high risks and are subject to significant price volatility. You may lose all of your invested principal. Please fully understand the relevant risks and make prudent decisions based on your own financial situation and risk tolerance. For details, please refer to
Disclaimer.
Related Articles
Pi Network Approaches Key Price Level — Breakout or Bull Trap Ahead?
Price Action: PI trades near $0.20 supply zone after short-term 5% rally.
Technical Signals: H4 chart bullish, but higher timeframe trends remain bearish.
Trading Strategy: Watch $0.1857 support and $0.216 resistance for breakout or bull trap confirmation.
Pi Network has shown
CryptoNewsLand24m ago
Chainlink builds a bridge between traditional finance and blockchain, driving demand for LINK
Chainlink is emerging as a crucial bridge between traditional finance and blockchain, particularly as asset tokenization grows. Its oracle network provides verified data and compliance for tokenizing assets, while Payment Abstraction v2 allows businesses to pay in fiat, converting to LINK tokens. This creates continuous demand for LINK, supported by large organizations testing the technology.
TapChiBitcoin41m ago
BTC 15-minute increase of 0.70%: On-chain capital inflow and market sentiment resonate to drive price movement
From March 10, 2026, 08:00 to 08:15 (UTC), BTC achieved a +0.70% return within 15 minutes, with a price range of 70375.2 to 70926.3 USDT and an amplitude of 0.78%. This short-term fluctuation is significantly higher than the volatility of mainstream coins during the same period, attracting market attention. The increased volatility has prompted investors to closely monitor the market.
The main driver of this fluctuation is large on-chain capital inflows into mainstream trading platforms, with a surge in short-term buying activity. Additionally, some institutional or whale accounts concentrated their positions during the window period, significantly driving the price upward. Meanwhile, market exchanges BTC
GateNews48m ago
JELLYJELLY Contract and Spot Price Discrepancy at 34%, Manipulation Warning Alert Triggered
JELLYJELLY tokens experienced an extreme divergence of 34% between the perpetual contract mark price and the on-chain spot price on March 10, suspected of price manipulation. Analysis shows a surge in open interest and a funding rate reaching -2% every 4 hours, indicating market instability and manipulation risk. Analysts warn investors that this situation could trigger significant price volatility and reflects structural risks during the integration process of decentralized and centralized exchanges.
MarketWhisper1h ago
SHIB Price Drops Despite 53,000% Burn Increase — Understanding the Disconnect
Burn Impact: 172 million SHIB burned reduces supply by 0.00003 percent, too small to move price.
Market Pressure: Bitcoin retreat drags SHIB lower despite burn spike and headlines.
Technical Signals: Price tests $0.00000545 support; break below $0.00000530 could trigger further
CryptoNewsLand1h ago
CPI Data Preview: Bitcoin Approaching $70,000 Key Resistance, Crypto Market May Experience Volatile Fluctuations
As the US CPI data is about to be released, the cryptocurrency market is entering a wait-and-see mode. Bitcoin, after experiencing a correction, is approaching $70,000, and market sentiment has improved, but it faces a short-term key resistance level. CPI data will be the main factor driving short-term market volatility.
GateNews1h ago