
The Midnight price jumped more than 7.6% over the last 24 hours, pushing up toward $0.047, and honestly, there’s no huge news catalyst here. No partnership announcement, no exchange listing, no protocol upgrade. Just a good old-fashioned technical bounce from levels that were getting kind of ridiculous.
The move pushed the price from $0.044 up to $0.047 in a single candle, and the volume was there to back it up: 225 million NIGHT changing hands, just below the predicted volume of 262 million. That’s legit participation, not a low-liquidity pump.
Analyst Says Hedera (HBAR) Is Worth Watching Again – Here’s the Reason_**
- What the NIGHT Chart Is Showing
- The Bigger Picture
- What Comes Next for NIGHT
What the NIGHT Chart Is Showing
Looking at the 4-hour chart, the NIGHT price is now sitting around $0.0473, having broken above the $0.046 resistance that had been capping it for the past few days.
The OBV is sitting at 13.23 billion, just above its moving average, which indicates that volume is actually supporting the move. When the OBV is rising with price, it’s usually a sign that the move has legs.
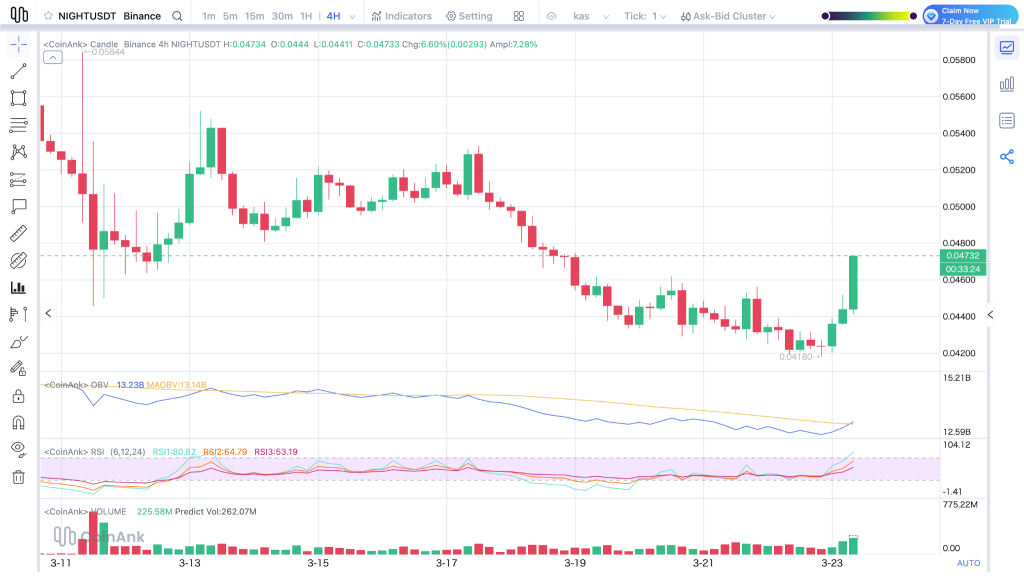
Source: CoinAnk
The RSI readings are interesting here. The fast RSI at 80.82 is screaming overbought. That’s the kind of level that usually comes with a warning label. The medium and slow RSIs are at 64.79 and 53.19, which are less extreme.
So the short-term momentum is hot, but the longer-term momentum is still catching up. That can sometimes mean a pullback is coming, or it can mean the rally is just getting started. Hard to tell.
Here’s Why DeXe (DEXE) Price Pumped 200%_**
The Bigger Picture
It’s worth remembering that NIGHT was on the weekly losers list recently, down 16.6% last week. So this pump is really just recovering some of those losses. The privacy tech narrative is still there, and the Cardano integration is still on the horizon. The mainnet launch is supposed to be coming soon, which could be a real catalyst if it actually delivers.
But for now, this move looks like a technical bounce. The NIGHT price hit a level where buyers decided to step in, and the momentum carried it higher. The real test is coming up at $0.048 to $0.050. If it can break through that, the structure changes. If it gets rejected, we could be looking at a retest of $0.044.
What Comes Next for NIGHT
The NIGHT price is moving on decent volume, and the chart is showing some strength after weeks of bleeding. The fast RSI is overheated, but if it can hold above $0.044 and build momentum toward $0.048, that would be a sign that this bounce has more room to run.
River (RIVER) Price Keeps Pumping as TD Indicator Signals Another Rally_**
On the downside, $0.042 is the level to watch. A break below that, and the downtrend probably resumes. For now, Midnight is having a moment. Whether it lasts depends on whether the volume sticks around.
Disclaimer: The information on this page may come from third parties and does not represent the views or opinions of Gate. The content displayed on this page is for reference only and does not constitute any financial, investment, or legal advice. Gate does not guarantee the accuracy or completeness of the information and shall not be liable for any losses arising from the use of this information. Virtual asset investments carry high risks and are subject to significant price volatility. You may lose all of your invested principal. Please fully understand the relevant risks and make prudent decisions based on your own financial situation and risk tolerance. For details, please refer to
Disclaimer.
Related Articles
Trump's Ultimatum to Iran Fails to Materialize, BTC Stabilizes After Breaking Below $70,000 Over the Weekend
QCP Group points out that Trump's ultimatum to Iran failed to materialize, and the market stabilized briefly. Despite BTC breaking below 70,000, its resilience has strengthened. With U.S. national debt exceeding 3.9 trillion, stagflation concerns intensify, and central banks face policy dilemmas. Iran proposed settling transit fees in yuan, and the market should monitor shifts in BTC.
GateNews38m ago
Crypto Analyst Hints at ADA Price Uptick Based on Weekly Chart
Crypto analyst Ali Charts predicts a potential rise in ADA prices, currently up 5.50% in the last 24 hours. He suggests the token may surge further over the next three months based on historical price patterns and current market analysis.
TheNewsCrypto52m ago
BCH Shows Promising Buy Signal Traders Can’t Ignore
BCH holds key $440 support, showing potential for a short-term rebound.
The 4-hour chart indicates bullish flip with strong OBV and DMI signals.
Next targets lie at $494, $510, and possibly $570 if Bitcoin rises further.
Bitcoin Cash — BCH, has captured traders’ attention this week with
CryptoNewsLand1h ago
QNT Rally Tests a Crucial Supply Zone — What Next for Quant?
QNT rallied 24% weekly, testing a key supply zone near $80–$88.
Daily closes above $88 signal bullish continuation, while drops below $75 indicate renewed bearish pressure.
Short-term momentum is positive, but higher timeframe indicators suggest cautious trading.
Quant — QNT, has
CryptoNewsLand1h ago
Gold, Bonds, and Bitcoin: The Three Major Truth Revealers of Financial Markets
The article analyzes the recent performance of gold, bonds, and Bitcoin in current financial markets and the reasons behind it. Recently, rising bond yields, falling gold prices, and rising Bitcoin have demonstrated the market's reaction to uncertainty. Particularly in the Iran conflict, a liquidity crisis led to gold selloffs, while Bitcoin, as a non-sovereign asset, has gained favor. Looking ahead, oil prices are expected to continue rising, putting pressure on bonds and gold, with Bitcoin outperforming other assets. Financial markets will be significantly influenced by geopolitical factors.
金色财经_1h ago
Zcash News: Smart money quietly increasing holdings after ZEC's 55% pullback; the key breakout level is at $227
Zcash (ZEC) is currently oscillating around $226, facing pressure from a descending channel. Despite the appearance of bullish divergence and increased holdings by some investors, the market remains predominantly bearish. If it holds the $227 support level, it could potentially rally to targets such as $267; if it breaks below, it may test $191. Core factors include the stability of support levels and capital flow dynamics.
GateNews1h ago
