
Kaspa (KAS) has been sliding for months, but some analysts believe the worst of the correction may already be behind it. The token reached a key technical zone where several indicators are beginning to line up.
Crypto analyst Finance Freeman shared a chart suggesting the Kaspa price may be close to forming a bottom. The setup combines Fibonacci levels, long-term trend support, and price movement inside a falling channel.
This does not guarantee an immediate rally, but the chart shows a structure traders often watch closely when a market is trying to stabilize.
Here’s What The Kaspa Chart Is Showing
The Kaspa price has touched the 0.886 Fibonacci retracement level, a high retracement level that is commonly found at major bottoms.
Kaspa’s price has also touched an area around $0.24, which is near the lower boundary of the descending channel and a long-term trendline that was established before Kaspa’s All-Time High.
When multiple technical levels converge to a single location, traders take notice. These areas sometimes act as strong support where selling pressure begins to fade. The chart suggests the market may need more time to stabilize before making its next major move.
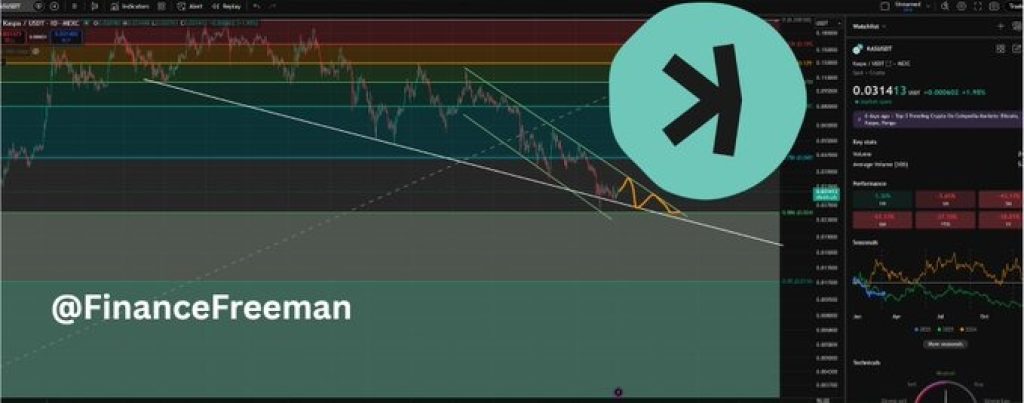
Source: X/FinanceFreeman
Finance Freeman also outlined a possible short-term path for Kaspa. On the chart, an orange path shows a scenario where the price moves sideways and forms a double bottom near the current support area.
This type of structure often appears when a market tests the same support level twice before reversing direction.
In this stage, the price movement may appear slow and choppy. The markets may be taking their time to digest the selling pressure, allowing the buyers to come back into the markets again. This, if the pattern develops correctly, may indicate that the downtrend is about to come to an end.
_****Hedera Gets Adopted At Central Bank Level As HBAR Superior Technology Stands Out**
What the KAS Chart Suggests for the Bigger Picture
After the possible double bottom forms, the analyst believes Kaspa could begin a larger move upward.
The long-term projection on the chart shows a path where the price could eventually move close to the $1 level. That would represent a huge increase from the current price range.
Of course, this type of scenario would take time and would depend on broader market conditions, continued growth in the Kaspa ecosystem, and stronger demand returning to the market.
For now, the most important level remains the $0.24 support zone. If that level holds, it strengthens the idea that the Kaspa price may already be building a base for its next cycle.
If the support fails, the market could still see further downside before a true bottom forms.
Disclaimer: The information on this page may come from third parties and does not represent the views or opinions of Gate. The content displayed on this page is for reference only and does not constitute any financial, investment, or legal advice. Gate does not guarantee the accuracy or completeness of the information and shall not be liable for any losses arising from the use of this information. Virtual asset investments carry high risks and are subject to significant price volatility. You may lose all of your invested principal. Please fully understand the relevant risks and make prudent decisions based on your own financial situation and risk tolerance. For details, please refer to
Disclaimer.
Related Articles
Bitcoin Reclaims $76,000 as US March PPI Misses Forecasts
Bitcoin surged past $76,000 following lower-than-expected US Producer Price Index data for March 2026, which indicated a 4% year-over-year increase. The rise reflects strong market support despite declining leveraged positions.
GateNews2h ago
BTC 15-minute rise of 0.64%: a technical breakout of key resistance combined with weak liquidity amplifies volatility
2026-04-14 15:30 to 15:45 (UTC), BTC saw short-term fluctuations within the 74,795.5 to 75,319.3 USDT range, with a return of +0.64% and a range of 0.70%. During this period, market attention warmed up, volatility intensified, trading volume rose slightly compared with the previous hour, and short-term buy orders pushed the price upward quickly.
The main driver of this unusual move was BTC’s short-term technical breakout above the 74,000 USDT key resistance, which generated a long signal and triggered rapid responses from quantitative and programmatic buy orders. At the same time, because the order book depth has been rising since 2025
GateNews2h ago
ETH rose 1.06% in 15 minutes: global political stimulation and a coordinated boost to risk appetite and on-chain activity together drove the move
From 15:30 to 15:45 (UTC) on 2026-04-14, the ETH price range was 2340.75 to 2367.0 USDT. Within 15 minutes, the return rate reached +1.06%, and the amplitude was 1.12%. Market volatility intensified, and on-chain and social attention rose in tandem. Short-term trading activity increased significantly, and investor sentiment shifted to optimism.
The main driving force behind this market move is the direct impact of an international political event on risk appetite. The United States announced a blockade of the Strait of Hormuz in the Middle East region related to the White House, creating a stark contrast with peace signals reportedly coming from Iran, and it triggered uncertainty and panic sentiment in the market.
GateNews2h ago
Bitmine gets promoted to the NYSE main board! Tom Lee: US stocks may be at a bottom, with selling pressure on Ether easing
Bitmine has officially moved from the NYSE American board to the main board, marking an important milestone for the company. Despite a sharp decline in its stock price, it has still increased the share repurchase plan to $4 billion. The company holds a large amount of Ether, and it expects that a rebound in the crypto market will help enhance its assets and stock price performance.
CryptoCity3h ago
Bitcoin Reclaims $75,000 for Second Time Since US-Iran Conflict, Up 7% in 24 Hours
Bitcoin surged to $75,000 amid rising U.S.-Iran tensions, adding $98 billion to its market cap and causing $500 million in liquidations. Technical analysts suggest that holding support above $67,000 could lead to an increase toward $80,000, despite highlighting $50,000 as a critical level if support fails.
GateNews3h ago
Crypto market splits as RaveDAO soars 200% while Polkadot, Zcash slide
RaveDAO jumps over 200% while Polkadot, Zcash and Dash slide, underscoring how idiosyncratic token stories now dominate a crypto market still digesting macro shocks and regulatory risk.
Summary
RaveDAO leads today's large‑cap crypto movers with a gain of more than 200%, while several majors, in
Cryptonews4h ago
