The Injective price has fallen sharply from its previous all-time high, leading some traders to question whether the project has lost its momentum.
However, a recent technical analysis shared by top analyst Crypto Patel suggests that the recent decline may actually represent a typical market reset rather than the end of the project’s growth potential.
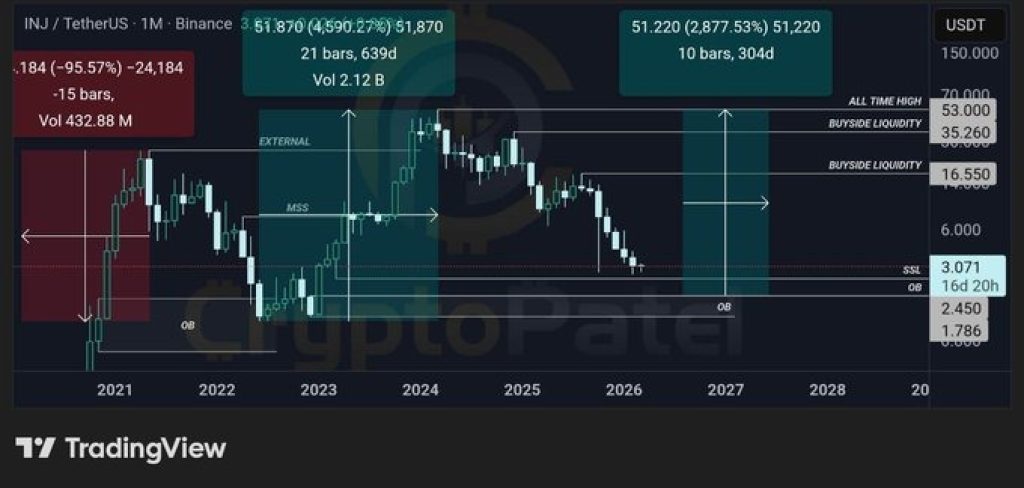
According to the analysis, the INJ price has corrected by roughly 95% from its peak, a move that often happens during major crypto cycles.
Such steep corrections usually clear out late buyers and excess liquidity from the market, allowing stronger long-term accumulation to take place. In many cases, this type of reset creates conditions for the next large price expansion once the market structure stabilizes.
Here’s What The INJ Chart Is Showing
Looking at the monthly timeframe, the chart shows that the INJ price tapped into a monthly order block, which represents a high-timeframe demand zone where institutional buying activity can appear.
These zones are closely watched by traders because they often mark areas where large investors previously accumulated positions.
After reaching this demand zone, the chart reportedly showed a powerful impulsive expansion of around 4500%, suggesting a strong reaction from buyers at that level.
This type of displacement is often interpreted as confirmation that the order block is valid and that significant demand exists in that price region.
The analysis also highlights a Market Structure Shift (MSS) on the macro chart. A structure shift like this can signal that the long-term trend is beginning to change. If this new structure holds and the market continues forming higher lows over time, it could strengthen the case for a larger recovery move.
Source: X/CryptoPatel
Liquidity Targets Point to Large Upside Potential For INJ price
If the broader market structure remains intact, the chart suggests several potential upside liquidity targets for INJ in the longer term.
The first key level sits around $16, followed by higher targets near $35 and $53, which correspond to areas where liquidity may exist on the chart.
Achieving those levels from current levels is a potential move of more than 2800%, as per the analysis.
_****AI Predicts Where ADA Price Is Headed Next After Cardano’s Technical Flip**
However, the move is said to be a gradual process, and traders are advised to look out for confirmation signals before entering into a trade.
The strategy that is being used in the analysis is one of patience. Waiting for higher lows to be established on a weekly chart is said to be a confirmation of the resumption of bullish momentum.
Also, looking out for a Change in State of Delivery (CISD) on a pullback is said to be a clearer entry point when the market is said to be trending upwards.
For now, however, while the cryptocurrency has indeed experienced a severe correction, the INJ chart does seem to suggest it may be entering a long-term accumulation phase, which may eventually lead to the next major move. As with all technical analysis, it should be noted that such a move is purely speculative, and research should be done before investing.
Disclaimer: The information on this page may come from third parties and does not represent the views or opinions of Gate. The content displayed on this page is for reference only and does not constitute any financial, investment, or legal advice. Gate does not guarantee the accuracy or completeness of the information and shall not be liable for any losses arising from the use of this information. Virtual asset investments carry high risks and are subject to significant price volatility. You may lose all of your invested principal. Please fully understand the relevant risks and make prudent decisions based on your own financial situation and risk tolerance. For details, please refer to
Disclaimer.
Related Articles
PEPE Reclaims 0.00000400 — Is This 1.8% Move the Start of a Bigger Run?
PEPE rebounds from 0.00000385 support, forming higher lows and stronger bullish structure.
Technical indicators like MACD and RSI show momentum with room for further upside.
Key resistance at 0.00000410; support at 0.00000380 critical for trend continuation.
PepeCoin — PEPE, has
CryptoNewsLand2h ago
ETH drops 0.58% in 15 minutes: derivatives liquidity contraction and proactive position reduction dominate short-term pullback
From 2026-04-19 04:30 to 2026-04-19 04:45 (UTC), within ETH’s 15-minute candlestick chart, the return recorded -0.58%, and the price range was 2321.62 to 2342.04 USDT, with an amplitude of 0.87%. The short-term selloff occurred against a backdrop of increased overall market volatility and a broad decline in the prices of major crypto assets; overall market risk appetite clearly fell, and traders’ wait-and-see sentiment strengthened.
The main driver behind this abnormal move is a sharp contraction in liquidity in the derivatives market and leveraged funds proactively reducing positions. Data shows that over the past 24 hours, the ETH/USD perpetual contract trading volume dropped 67.16% to approximately 74.87 million, open interest edged down 3.33% to 329 million, and liquidation amounts did not expand unusually. This structure indicates that the market lacks the risk of passive cascades; more funds chose to proactively step aside and wait on the sidelines, intensifying short-term selling pressure.
In addition, the long/short structure in which shorts held the upper hand (long/short ratio 47.48%:52.52%) and sentiment synchronization with the panic range reinforced the downward price trend. During the same period, major coins such as BTC and SOL also fell 2%-3.4% in tandem, further showing that this pullback was driven by system-wide risk sentiment. On-chain funds did not show any large abnormal transfers or large-scale liquidations of DeFi protocols; spot and on-chain liquidity remained generally stable, and no sudden system risk resonance was observed.
Current volatility-related risks still need close monitoring, especially as overall risk appetite continues to contract—ETH’s short-term price may face further downside probing. Watch subsequent changes in derivatives trading volume and open interest, extreme shifts in the long/short ratio and funding rate, and promptly monitor on-chain fund flows, large transfers, and any signs of amplified platform net outflows. For more market anomalies and deeper analysis, please continue to follow our upcoming market updates.
GateNews3h ago
Spark Protocol's January delisting of rsETH proves prudent as Aave faces ETH liquidity crisis
Spark Protocol's strategy of delisting low-usage assets and tightening collateral has faced initial backlash but proved wise during market turmoil. While maintaining higher interest rate caps, SparkLend ensures liquidity, unlike Aave, which now faces significant risks.
GateNews3h ago
Request Network (REQ) Surges 23.68% in 15 Minutes, 24-Hour Gain Reaches 116.52%
Request Network (REQ) surged 23.68% in just 15 minutes, reaching $0.152, with a 24-hour rise of 116.52% and trading volume over $8 million. Factors include retail interest and whale accumulation. Resistance at $0.160 and support at $0.122 are under observation.
GateNews4h ago
Solana Price Stalls Near $80 as ETF Outflows Weigh
Solana trades around $80, facing bearish sentiment due to ETF outflows and declining retail participation. Technical indicators show mixed signals, with resistance at $87 and $98, while support at $77 remains critical for stability.
CryptoFrontNews9h ago
Dogecoin Holds $0.094 as X Cashtags Drive Market Attention
Key Insights
Dogecoin holds above $0.094 despite market weakness as Bitcoin and Ethereum stabilize, reflecting resilience and sustained demand across major cryptocurrencies during the consolidation phase.
X launches smart cashtags enabling real-time crypto and stock tracking, improving marke
CryptoNewsLand12h ago
